
The Charts Behind the Costume
Macro View and Risk Framework
Where the letter’s thesis meets the tape, and the conditions under which risk goes on.
The View
Thirty five charts in this appendix and one thesis running through all of them. The price of money is repricing everywhere at once, and it is repricing for fiscal reasons rather than growth reasons. AI is not the cause of what follows. It is the largest borrower standing in front of it outside of governments.
Four sovereign curves are moving the same way and none of it is explained by growth. US 10yr at 4.80% breaking a wedge that targets 6.249%, US 30yr on a 5% handle, UK gilts back at 2008 levels, JGB 10yr through 3% for the first time since 1996 and through the rate the MOF budgeted FY2026 debt servicing at. China is the same imbalance inverted, yields at record lows and deflation exported, which is why Washington and Beijing are both accumulating the one asset neither can print.
The transmission runs through the 10yr rather than the 30yr. A move toward 6% lifts the hurdle on every dollar borrowed against future compute revenue, and credit has begun pricing that already, single name rather than index. Equities are last to know. DJIA printed a record 43,180 through the next stretch (the ultimate high to date was in 54,736 on August 3rd, with non-confirmation by all other indices). And gold and silver have already led lower. That is the 2007 into 2008 sequence, and it is what the rest of this appendix sets out.
What Would Confirm It
US 10yr holding above 4.80% on the path to 6.249%, with the 30yr taking out 5.268% and gapping toward 6.42%. JGB 10yr holding above 3% with the BoJ hiking this month, then USD/JPY breaking lower on the rate differential narrowing rather than on intervention, which is the only version of that trade that holds.
DXY through 101, because a genuine tightening in financial conditions produces dollar shortage rather than dollar abundance, and the record spec short is the fuel for it.
Single name credit spilling into the index, HYG rolling over and IG spreads moving with Oracle, Broadcom and Nvidia rather than around them. DJIA joining DJU and the Autos and Parts Titans to the downside, which converts a non-confirmation into a confirmed primary trend. SPX losing 7,410 and then 7,045, NDX through 28,910 and then 27,000.
And the ratio work, which is what the book actually expresses. SPX-gold and NDX-gold moving in gold’s favour, and GSR back above 69 with positive MACD divergence before silver goes on against gold.
What Could Invalidate It
The long end rallying and staying rallied. US 10yr back below 4.155% and the 30yr under 4.466% says the market believes short term hawkishness fixes a long term fiscal problem, which is the premise reversed.
A BoJ that blinks. A yield cap, JGB 10yr back under 3%, Japan resuming as buyer of foreign duration, and the mechanism disappears.
Single name credit retightening. Oracle back toward 145 and Nvidia reversing says the widening was idiosyncratic rather than a cycle signal. DJU reclaiming 1,202.79 and the Autos index back above 969 resolves the non-confirmation upward, at which point Dow Theory argues against me rather than for me.
DXY failing under 96 while equities make new highs is dollar abundance, no scramble and no deleveraging event. And gold falling while equities rally breaks the ratio thesis outright, whatever the dollar price of gold does on its own.
Risk Management, Putting On Risk
The positions themselves are set out on pages 32 to 35. These are the rules they sit inside.
Sizing and staging. October expiry across every leg deliberately, because the medium term view is a 15 to 20% correction already underway and the position needs room to be more than a one week wobble. Strikes laddered rather than concentrated, so the book pays across a range instead of needing one level to print. Convexity bought only where it is cheap, which is why the near dated NDX flyer works while VXN runs low relative to VIX.
Sequence. Nothing gets added into strength. First tranche on credit widening reaching the index rather than staying single name. Second on DJIA joining the other two Dow legs. The precious metals leg sits against the equity short rather than alongside it, so the expression is the SPX-gold and NDX-gold ratio rather than a directional call on the dollar price of gold.
Stops and discipline. The outright short on stock indices and PMs out of Jackson Hole I trade around, the options are the piece I leave alone. My weakness is running too big and ability to stay short too long PMs as I know we are in regime change positive for gold and silver, which is why gold got covered at 4,450 to 90 inside tolerance rather than at 4300 target. Not long silver against gold meaningfully yet until below a 69 GSR or I see MACD divergence to be long. And the miners — producers are what I want to be adding into a wholesale deleveraging rather than ahead of one, though I am fully allocated in my pension (patient capital) because if one recalls 2008, gold turns months before equities bottom and the miners are what you own coming out the other side.
US Rates — 30-Year
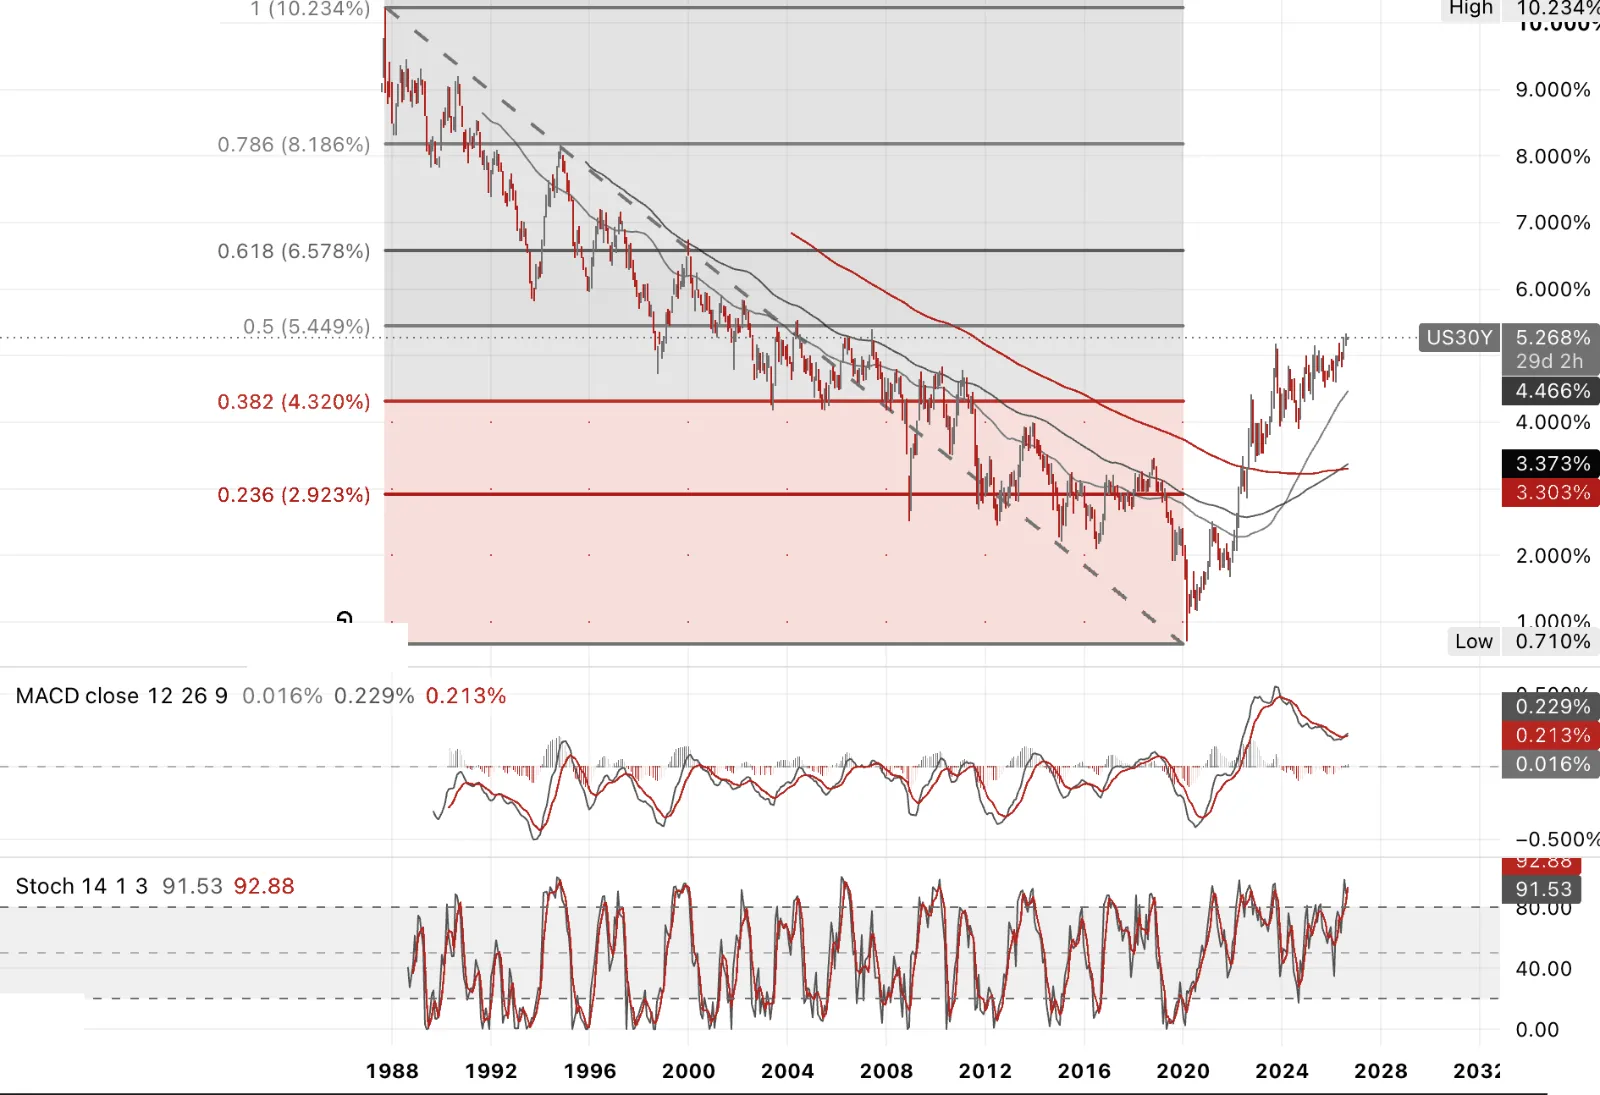
The US 30-year rate is where ‘long’ money actually gets priced, mortgages, corporate borrowing, the discount rate on anything with real duration. This feels more like fiscal incontinence than fiscal dominance. A 30-year breaking higher sends the bill burden straight to corporates refinancing debt and households pricing a mortgage today.
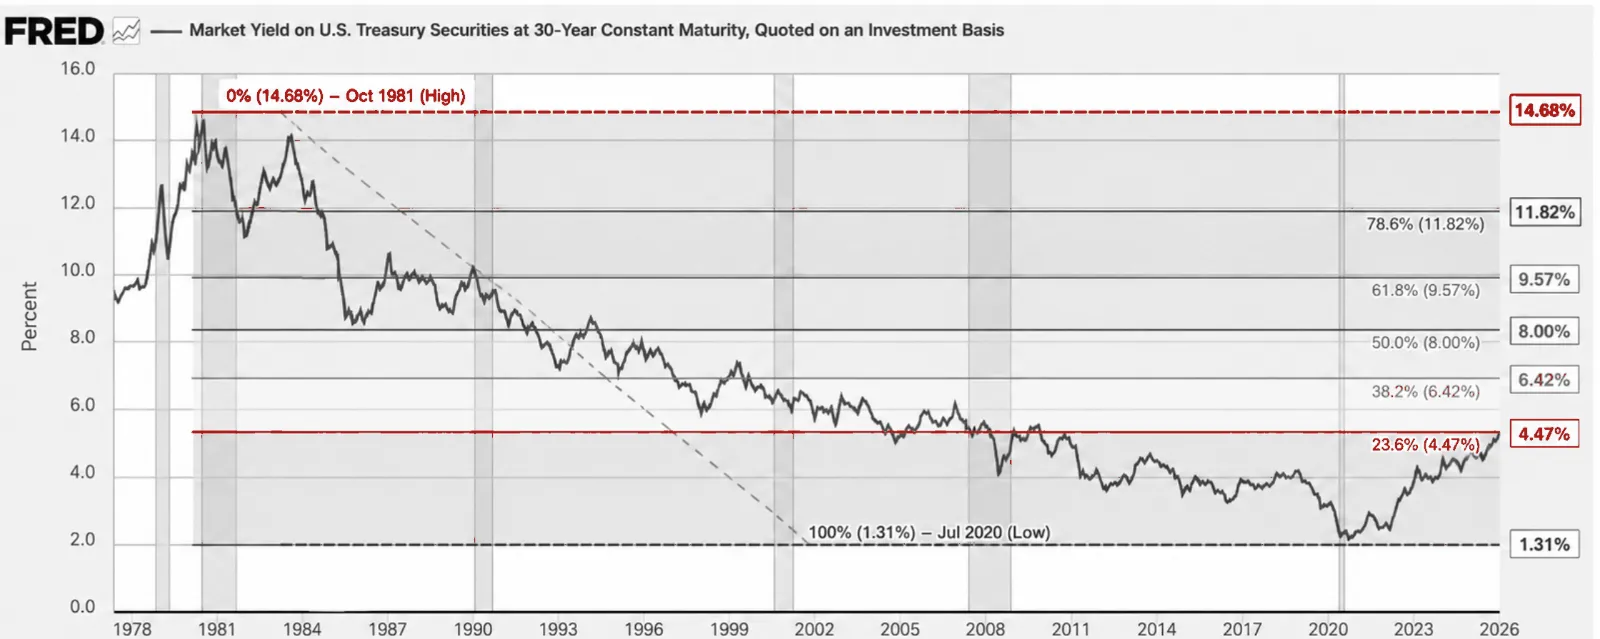
Imagine 8% on the 30-year. That's not a wild number, it's exactly the 50% retracement from the October 1981 high of 14.68% to the July 2020 low of 1.31%. Bessent is already twitching at a 5% handle, doubling the buyback program in August and drawing a public rebuke from his own mentor, Stanley Druckenmiller, the two once traded together on the bet that broke the Bank of England, in a Wall Street Journal op-ed. Druckenmiller's point cuts deep. The 30-year is the only fiscal disciplinarian the US has left, and managing its price instead of addressing the primary deficit doesn't fix anything, it just delays the invoice, as Stan put it. The real question is whether Washington has lost control of the long end globally, not just at home. Short of a BoJ-style yield cap, this market could gap straight through to the 38.2% retracement at 6.42%. The marginal buyer who used to show up and absorb this, the Japanese life insurers, isn't there anymore.
US Rates — 10-Year
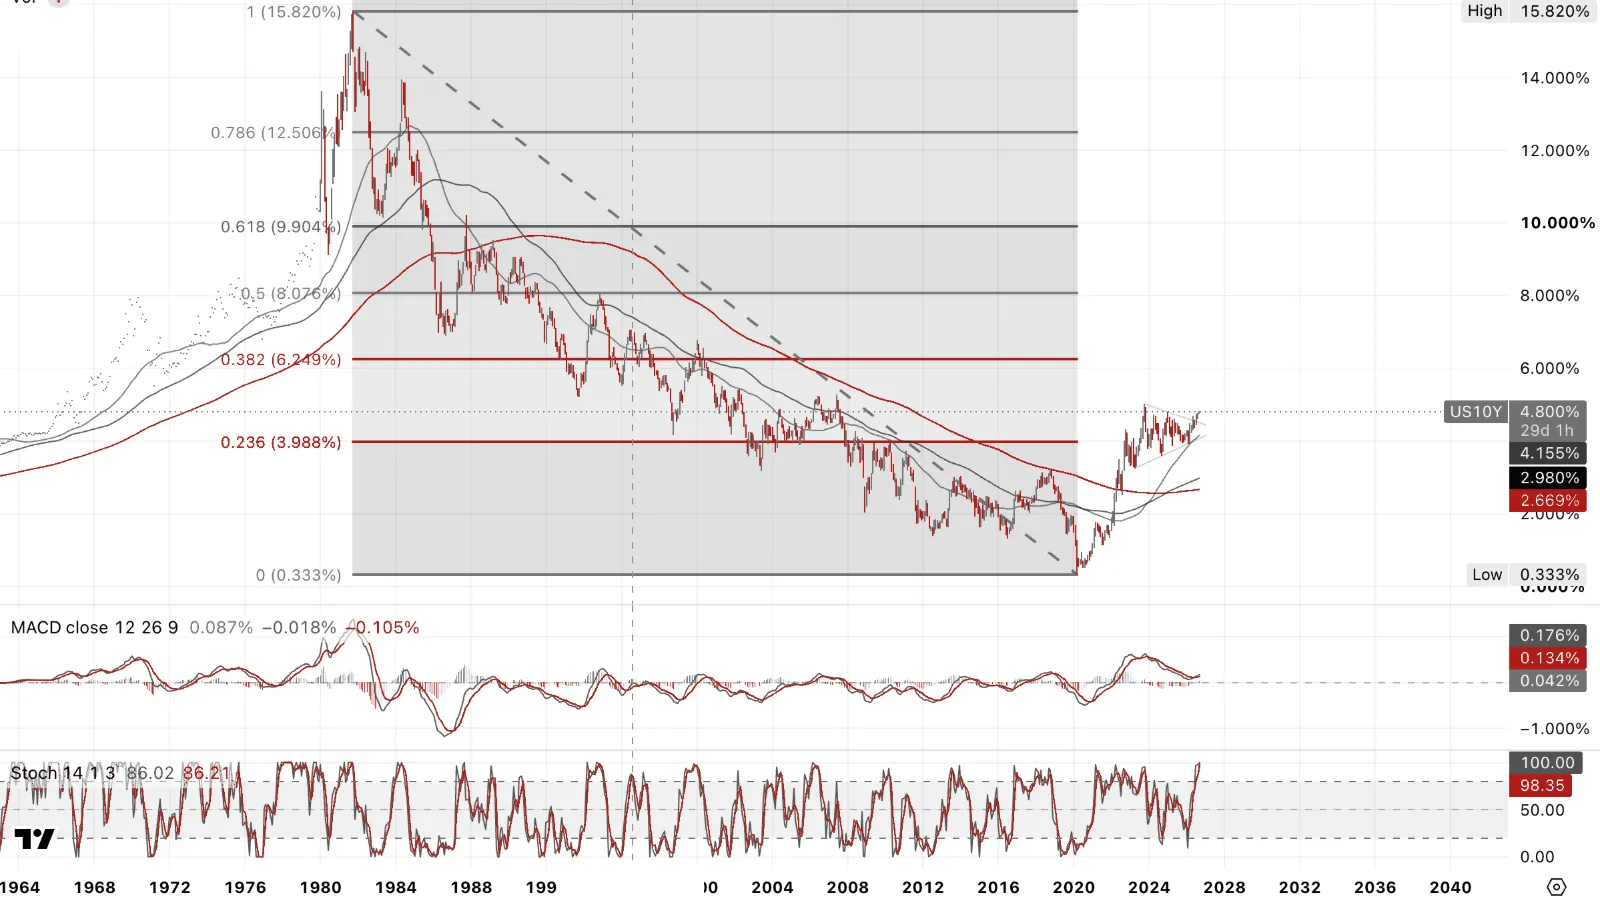
US 10yr breaking out of a classic rising wedge, target 6.249%. Not happening in a vacuum, just hit 4.80%, highest since Jan 2025. Hawkish Fed repricing post Warsh's JH pushed Sept hike odds from 36% to 65%+, and fresh US strikes on Iran pushing oil and yields higher together. Not a growth story, that's inflation risk and geopolitical risk stacked at once, the combination that makes a central bank's job hardest.
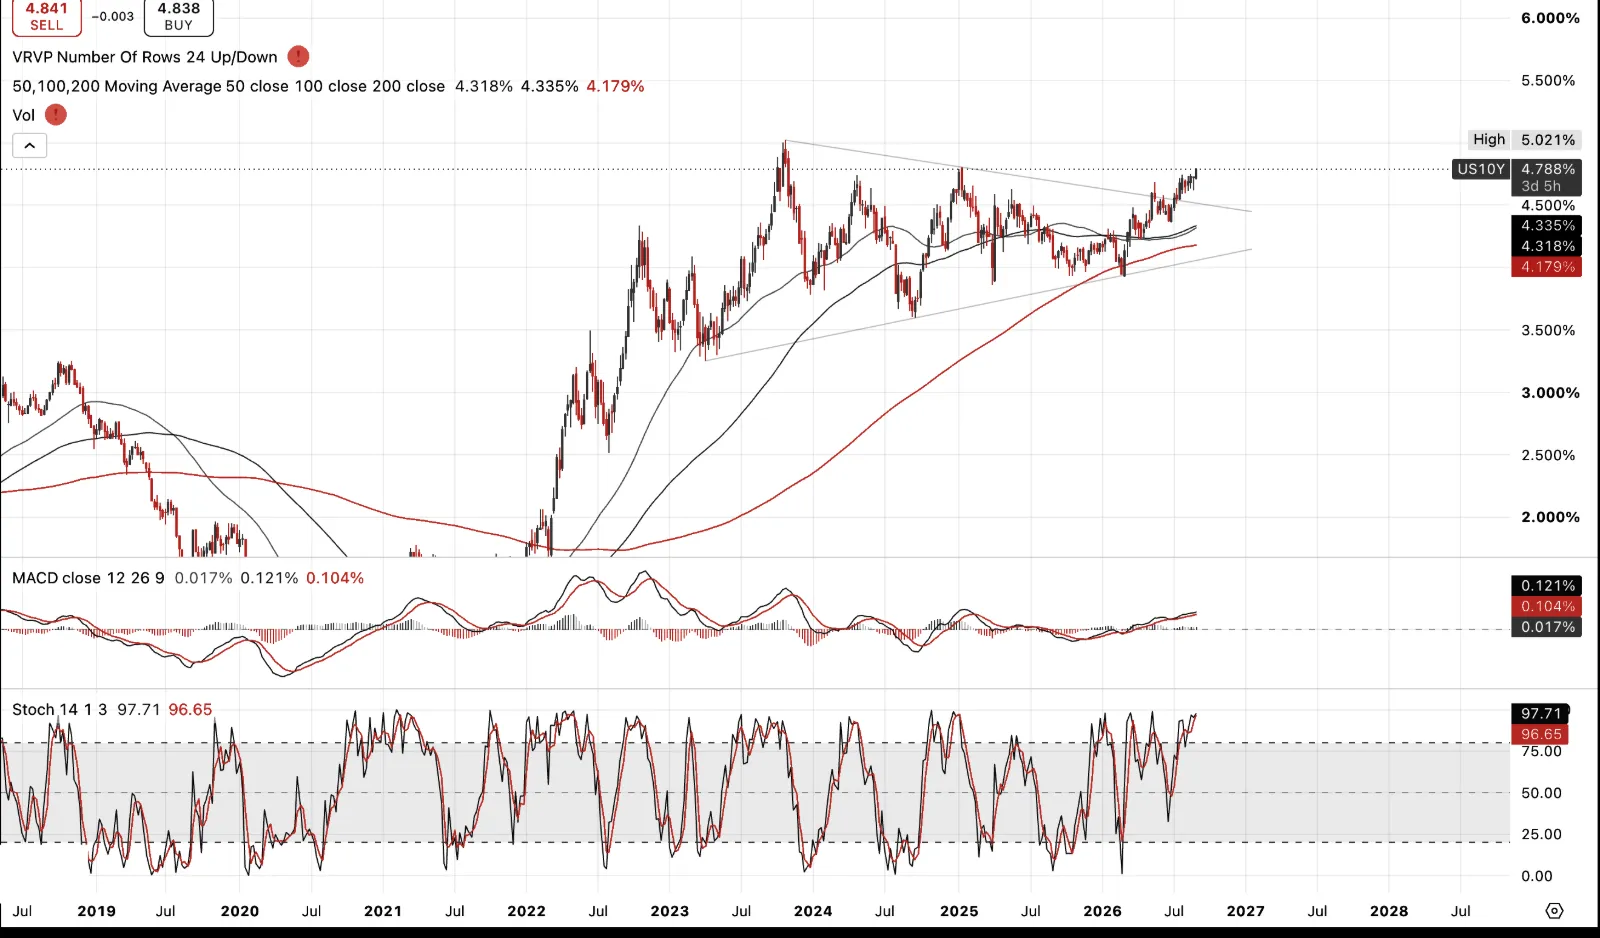
And this is the rate that actually prices discount rates and project financing, not the 30yr. A move toward 6% raises the hurdle rate the whole AI capex story has to clear, and raises the cost of every dollar of debt issued against future compute revenue. That's the trigger that could up-end AI debt issuance and the equity valuations sitting on top of it, not the technology failing, but the money underneath it repricing.
US Rates — 2-Year
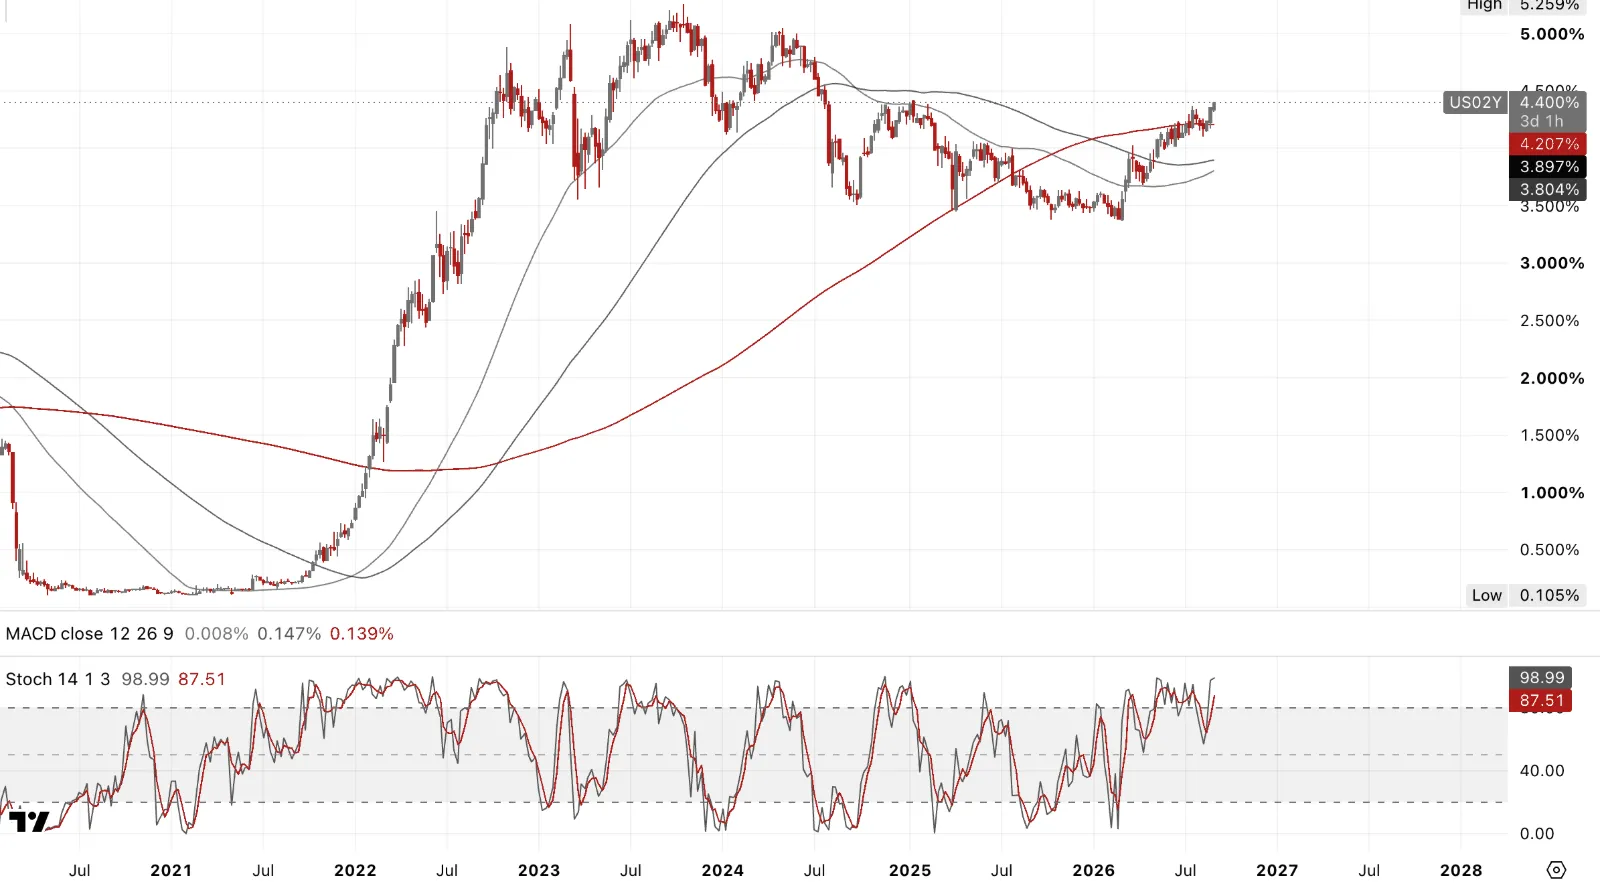
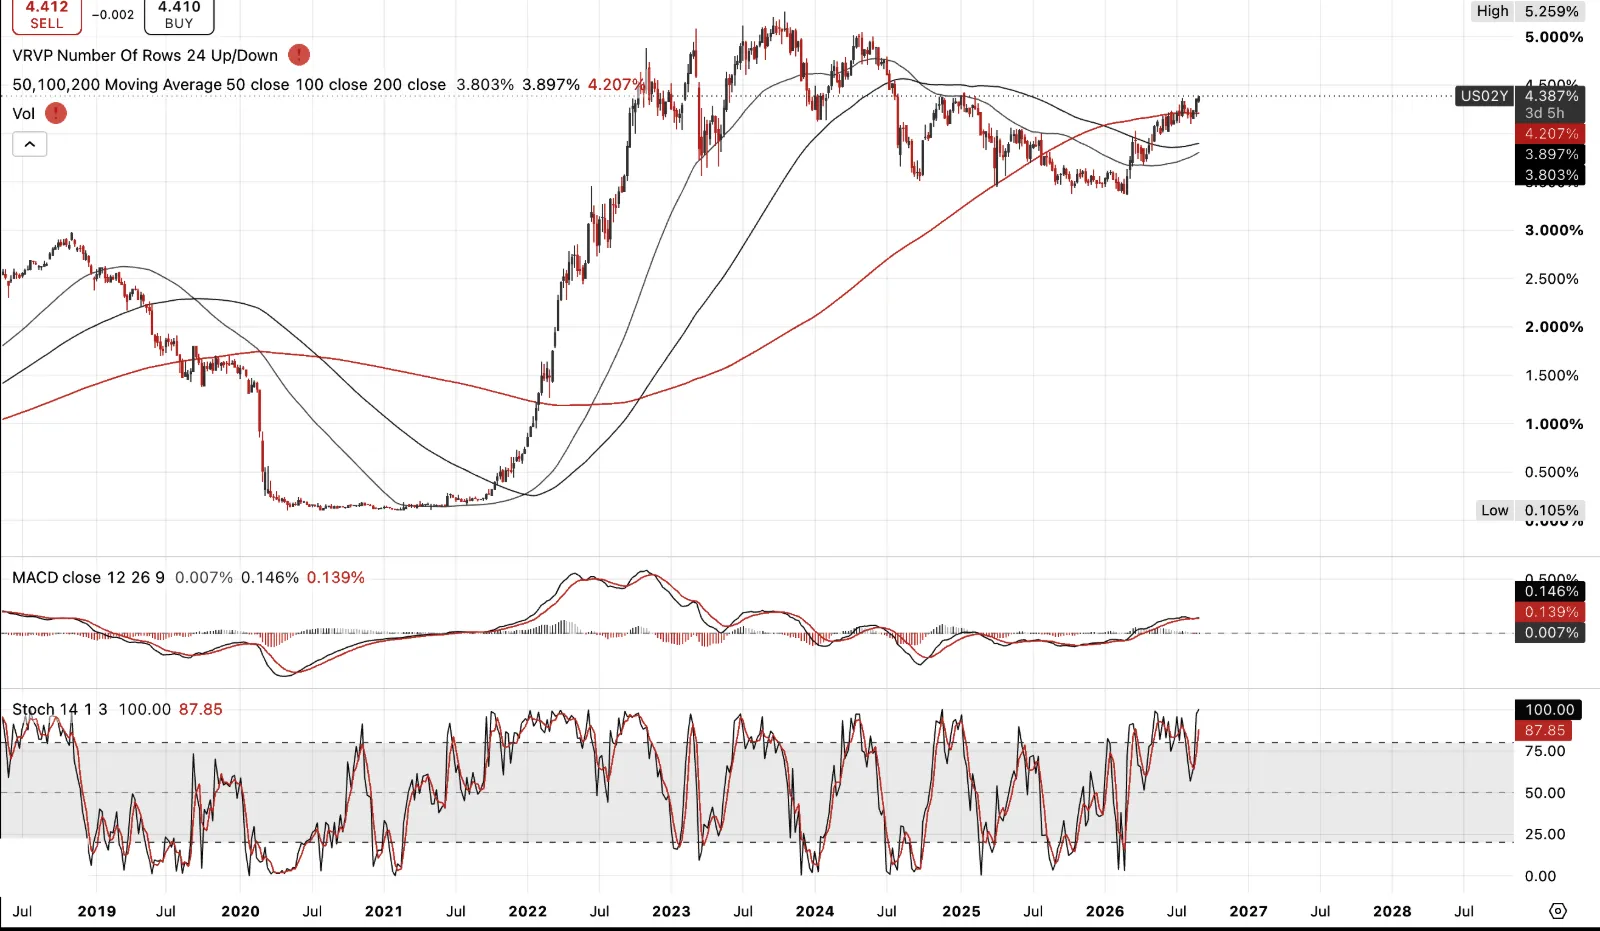
2yr rose hard post Warsh's JH comments, universally read as hawkish, jumping 11bps intraday to 4.34%, highest in a month. What was striking was the 10yr. Off the back of that 2yr tightening, it initially rallied, yield ticked lower, almost flat to down, as if applauding the Fed's credibility in finally addressing above-trend headline inflation. Then it reversed hard, closing the session up 5bps to 4.72%, erasing the whole move. 30yr did the same in miniature, briefly down 3bps before flipping to +2bps. The long end tried trusting the Fed for a few hours, then changed its mind. That's not a market convinced short-term hawkishness fixes a long-term fiscal problem.
UK Rates
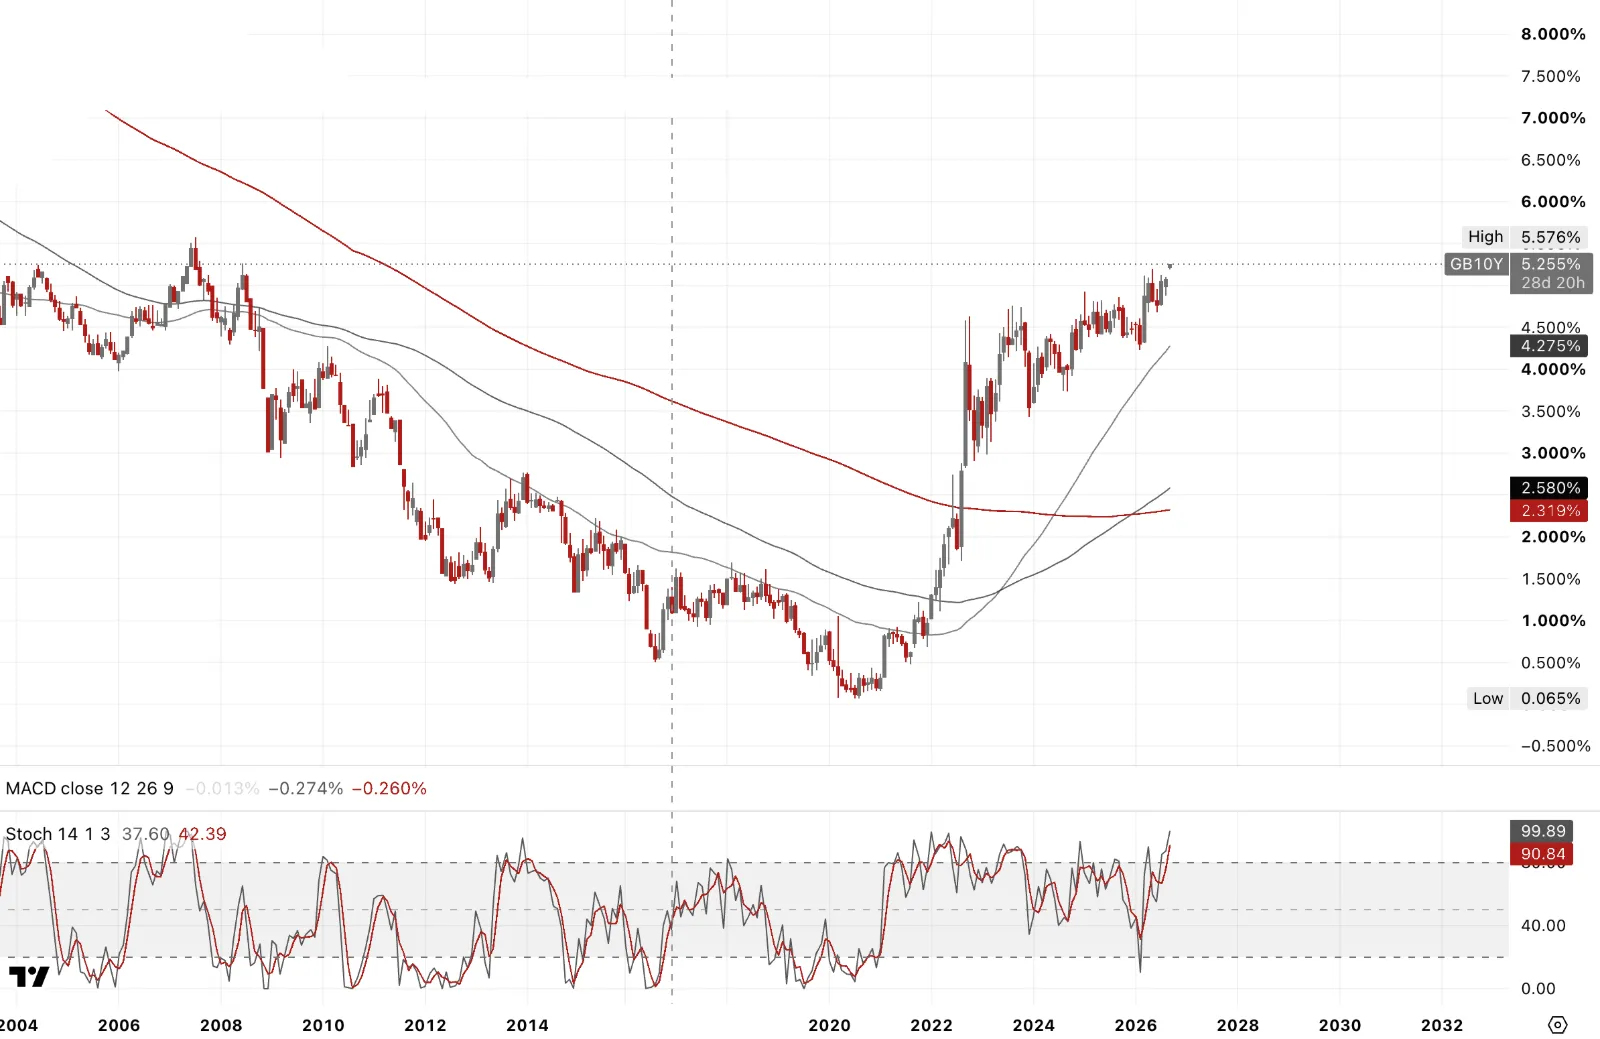
UK 10yr, and worth remembering up front, sterling isn't a reserve currency. Fiscal stress here doesn't get cushioned the way it does in the US, it shows up in the gilt and the currency together and rapidly. Think former UK PM Miss Lettuce. Bank Holiday aside, can't remember the last time I saw a gap on a rate chart on a Monthly. That alone should tell you something.
Burnham's already under fiscal pressure heading into his first autumn budget. The socialist rhetoric that got him the leadership definitely doesn't survive contact with the bond market, bye bye Burnham and his mock socialism. Bailey may well be right that second and third order inflation effects are subdued for now. But that's not today's problem. Today's problem is a country with no growth strategy, a welfare bill it can't shrink, and a central state too large for the economy underneath it to carry.
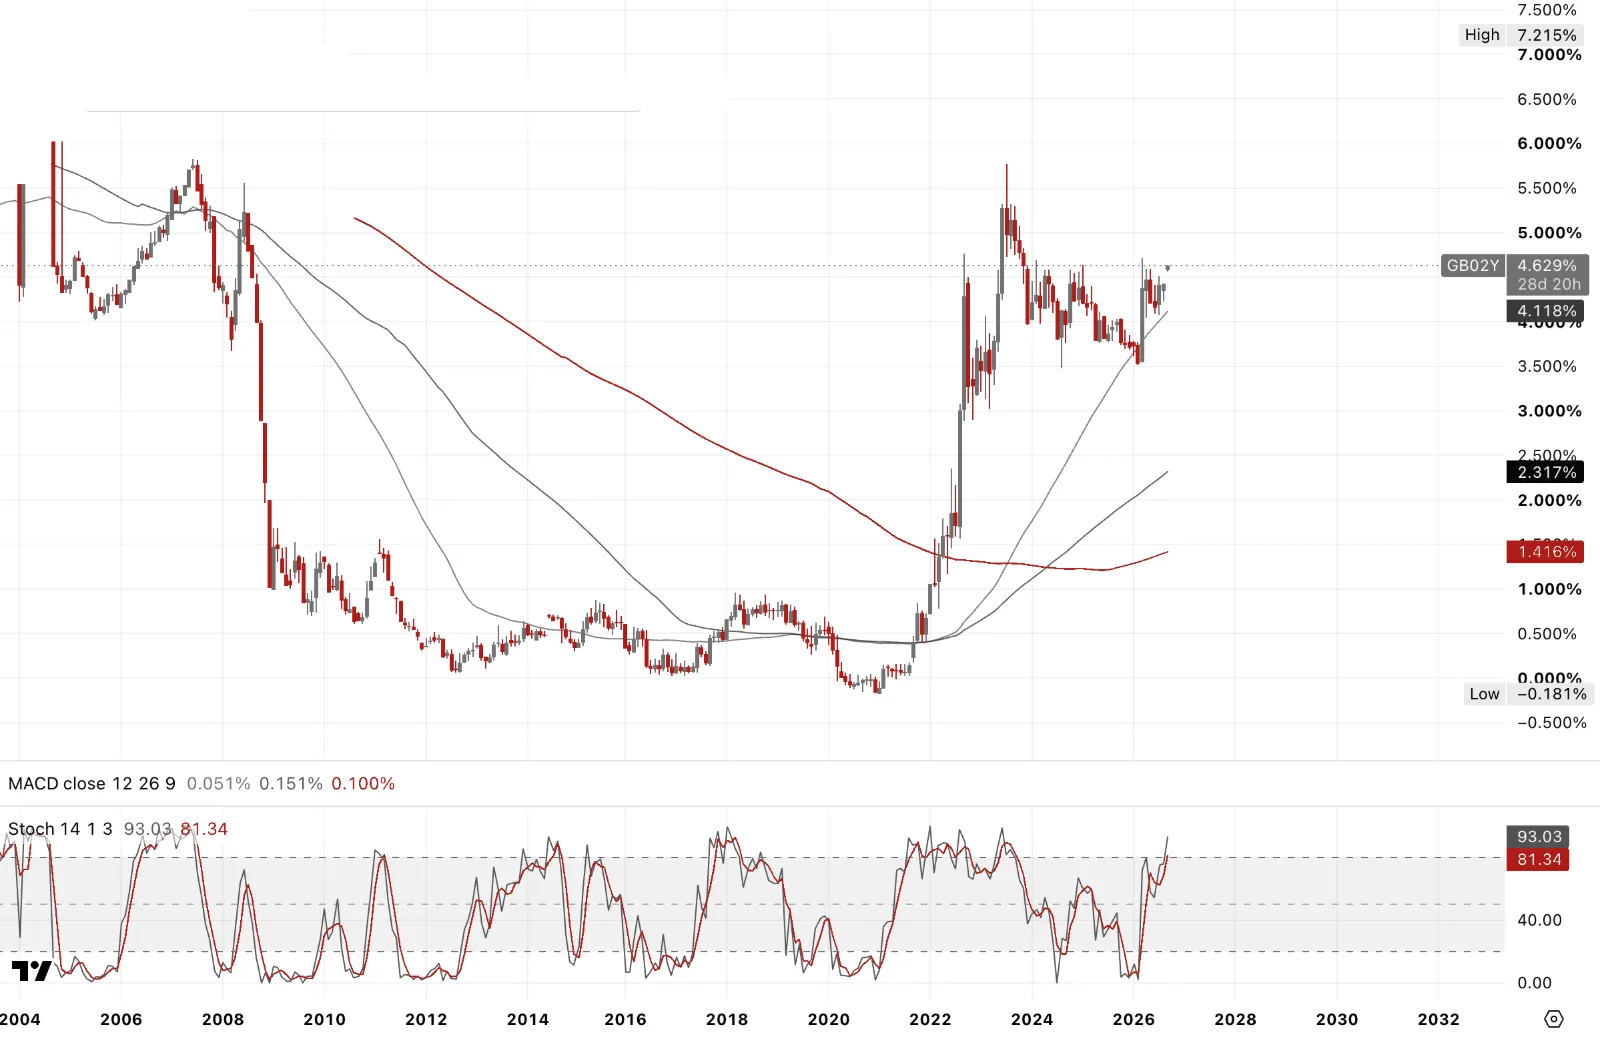
UK 2yr is the sharpest expression of this whole repricing. Base rate's been at 3.75% through a gradual easing cycle, markets were pricing cuts as recently as a few weeks ago. Now it's roughly 70% odds of a November hike and 80% for a second by February. That's the policy-sensitive end of the curve responding directly to Fed Warsh, or maybe to the Iran-driven oil shock.
Bailey called second-round effects "quite subdued" at Jackson Hole just days ago. The 2yr is already pricing the market's answer to that, and it doesn’t appear to be in agreement.
Japan Government Bonds
JGB 10yr through 3% for the first time since 1996. It's the end of thirty years of monetary history in one print. Government assumed 3% for FY2026 debt-servicing costs, so this isn't academic, it's already blowing through the MOF budget math.
PM Sanae Takaichi has doubled down on Abenomics reflation, not abandoned it, an investment-led growth platform, aggressive fiscal expansion, ambitions in semiconductors and AI, just with the BoJ finally now having to raise rates into it rather than suppressing them.
Here's what actually matters globally. Japan was the marginal buyer of duration everywhere for a decade, pension funds, insurers, even the BoJ itself, all running the same carry trade, yen funding, buying UST, Bunds, anything with yield. That buyer is gone. Yen isn't a funding currency in this anymore, it's the thing being defended.
Japan Government Bonds
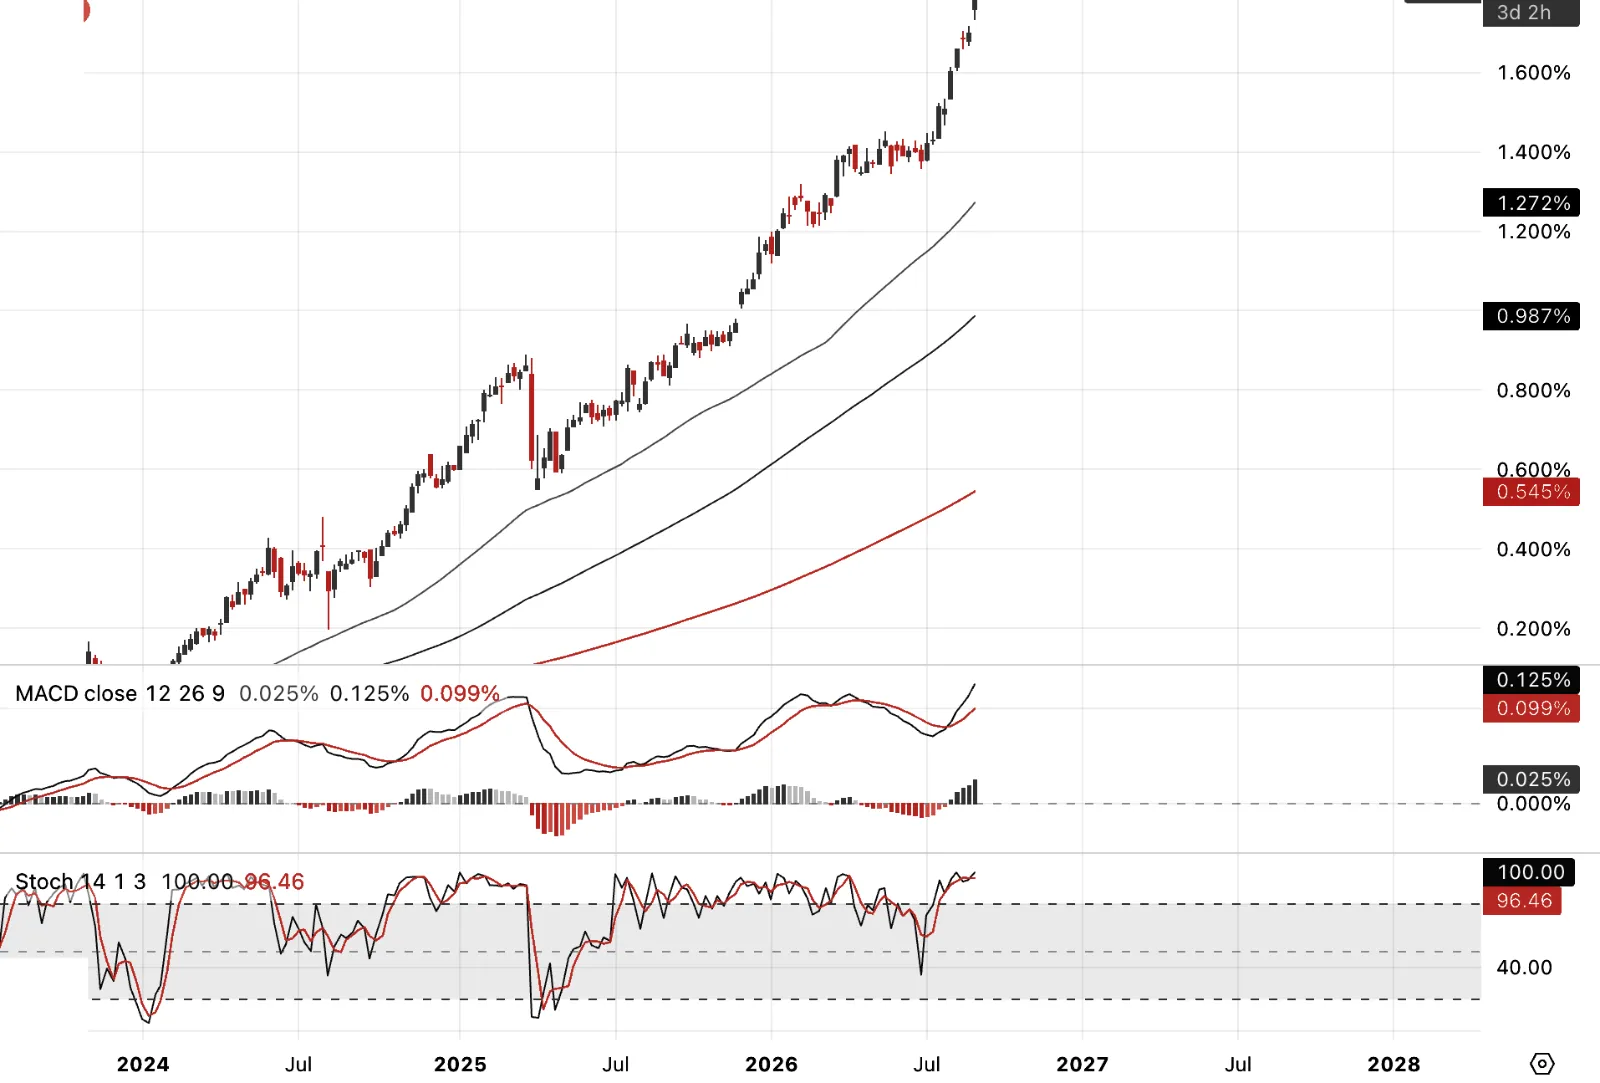
JGB 2yr at a 31-year high near 1.8%, 5yr at a record. This is the BoJ playing catch-up after being called "behind the curve" for years, with markets now pricing a hike this month as close to certain. The short end is telling you the wait is over.
And watch the independence question closely. It was unnerving, if I was a Japanese citizen, watching the photo opportunity posted on US Treasury Bessent's X feed. The day before, Bessent was on record publicly praising Ueda as an "underrated, savvy market operator" and insisting Washington doesn't dictate BoJ policy. Then, per NHK, behind closed doors he told Tokyo directly its next move should be a hike, so its currency strengthens and Japan doesn't have to intervene in yen/USD by selling its US Treasuries. Though that's better than a forced seller, it still guarantees no marginal buyer. Japan needs to be seen raising rates because its own inflation and fiscal math demand it, not because Washington asked.
China Rates
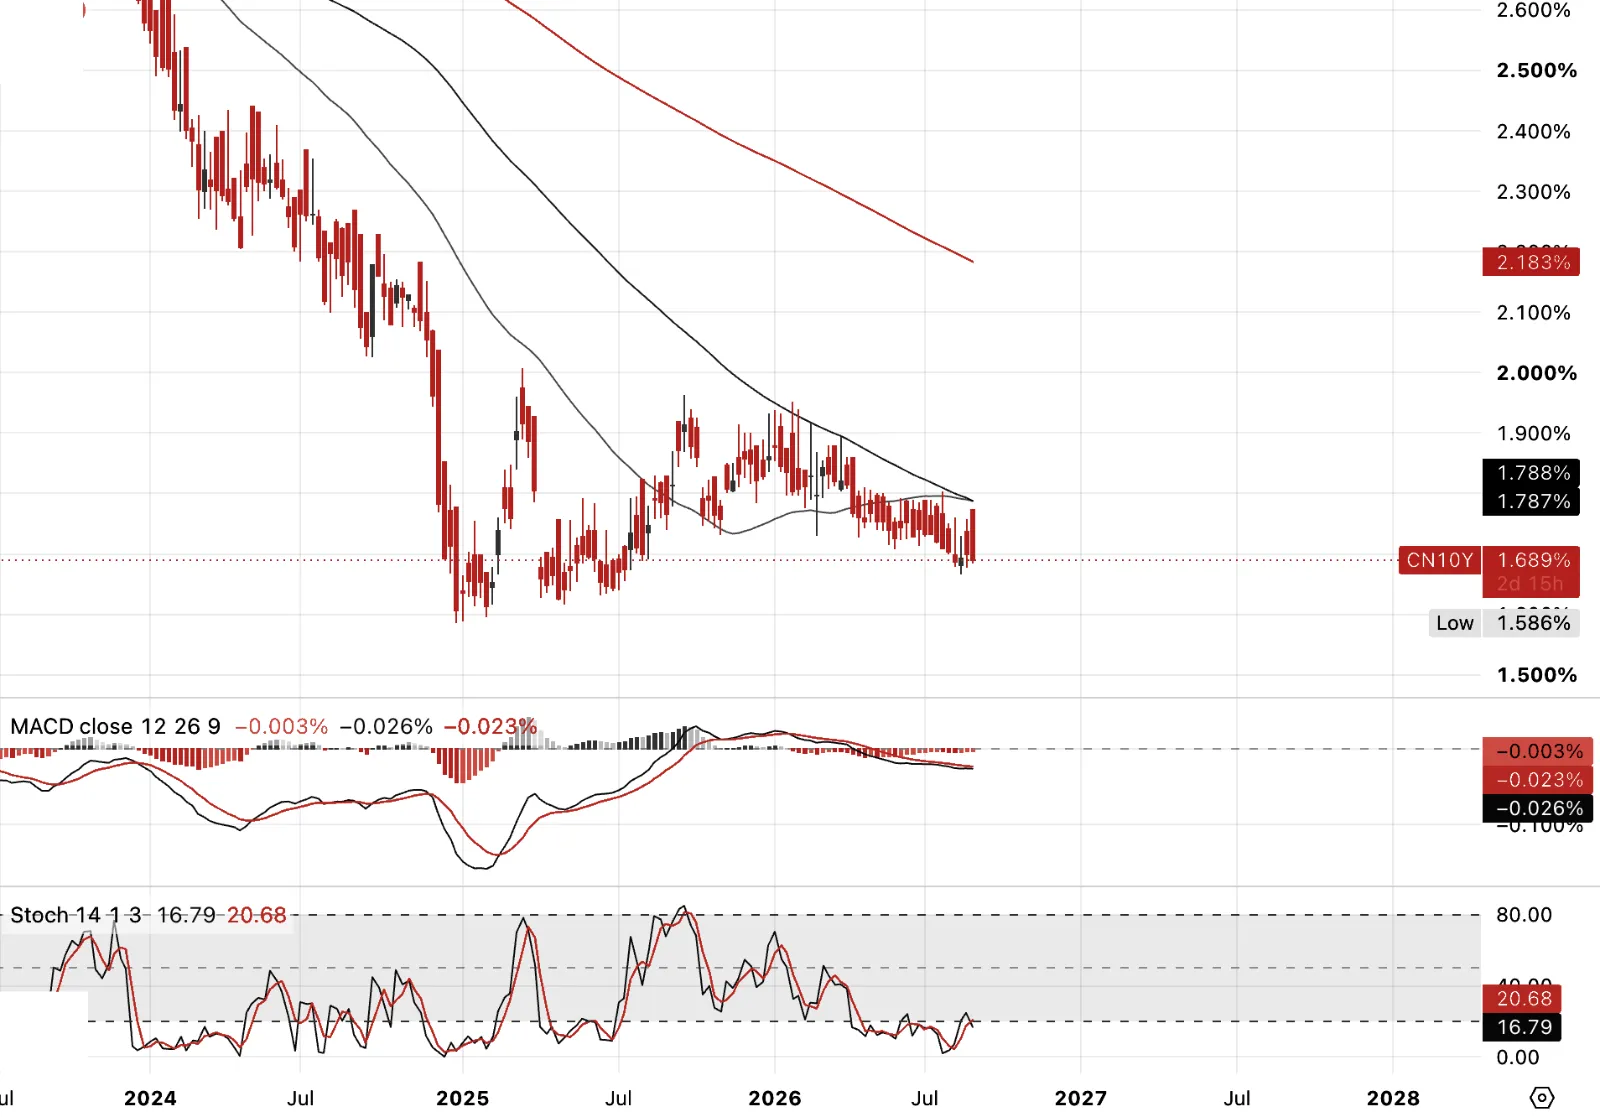
China 10yr is the other side of every chart on this page. Everywhere else, rates are breaking multi-decade highs on inflation. Here, yields are pinned near record lows, PPI negative for 30-plus months straight. This is debt deflation, plain and simple, the mirror image of a savings surplus that has nowhere productive left to go.
The capital investment boom that absorbed that surplus for two decades is failing. Fixed-asset investment is shrinking, not slowing, shrinking, and the misallocation underneath it is now surfacing as bad debt. What's notable is where that debt burden has migrated. It started in local government financing vehicles and trust products, opaque, off-balance-sheet, easy to paper over. It's now sitting on household balance sheets, mortgages against a housing boom that's turned into a housing bust. The state has quietly shifted the liability from institutions that could absorb it to the people who can't.
Step back and this is the other half of the global capital balance. The US runs the reserve currency and exports its excess liabilities to the rest of the world through Treasury issuance, fiscal incontinence funded by everyone else's savings. China runs the surplus side, exports deflation, and is now stuck holding the domestic wreckage of the investment boom that surplus financed. Two sides of the same imbalance, same trade, opposite symptoms.
And both sides are quietly reaching for the same asset to offset it. PBOC gold reserves have risen for 20 straight months, still under 10% of total reserves against roughly 70% for Western central banks. China's diversifying away from a dollar system it no longer fully trusts, the US is diluting the value of the liabilities it's issuing. Gold sits on the asset side of both balance sheets for exactly the same reason, it's the one thing neither government can print.
Precious Metals
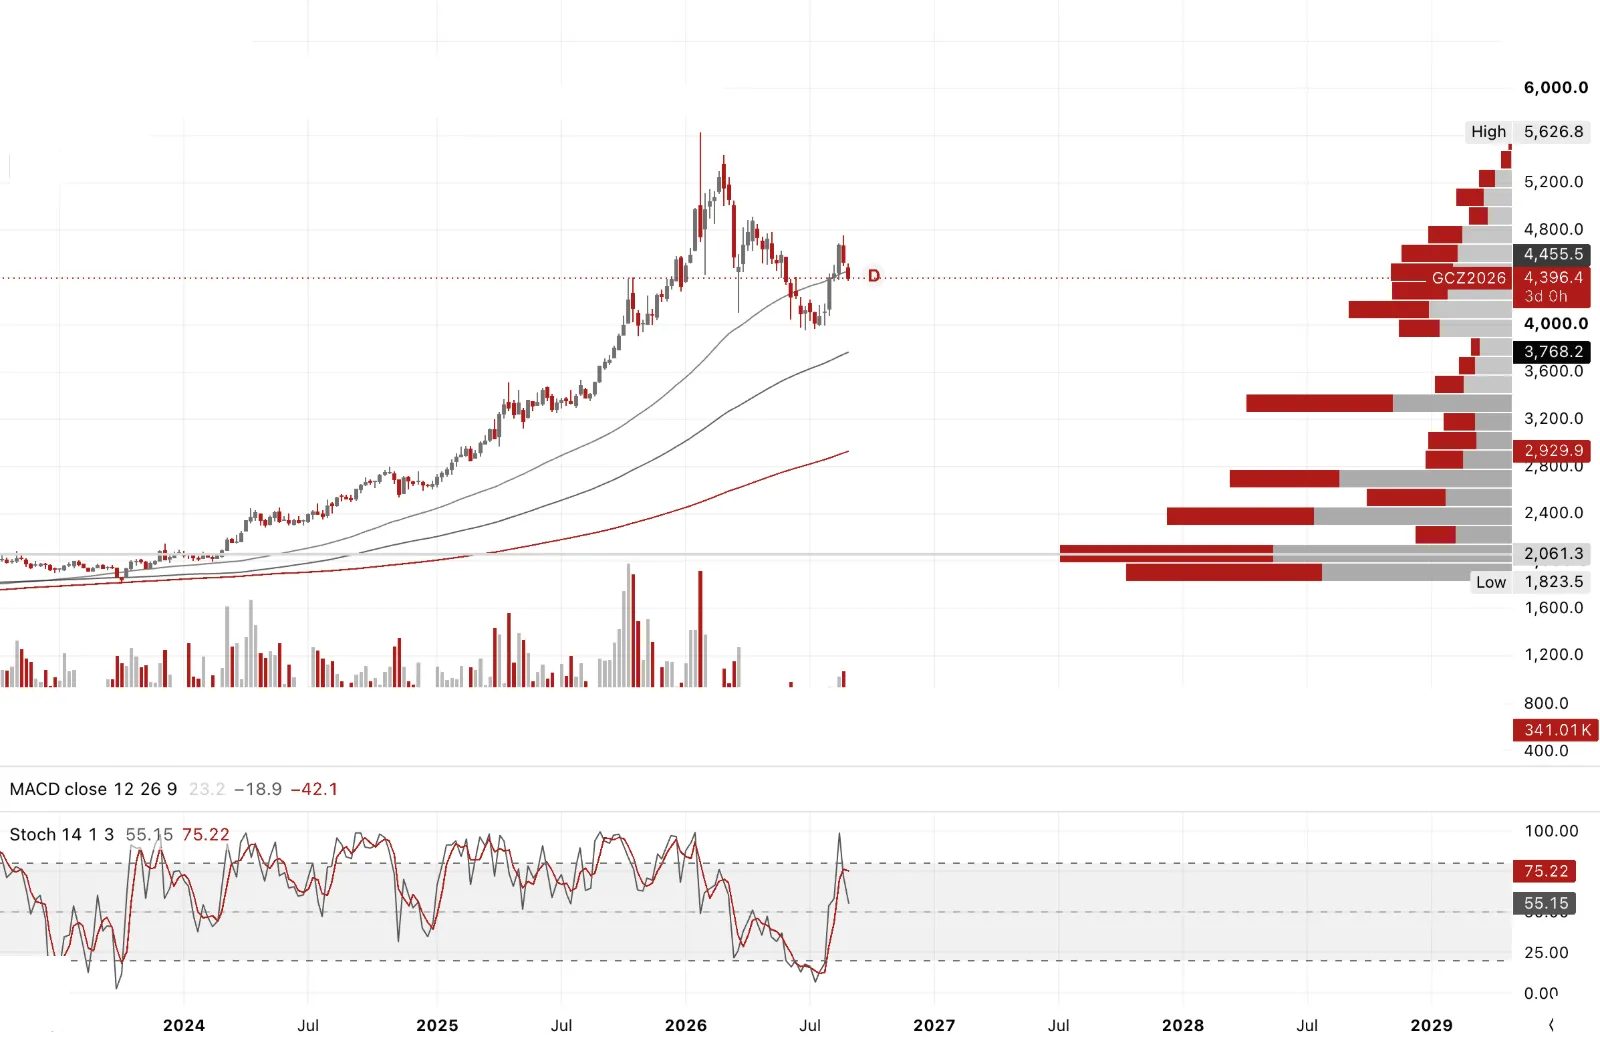
Gold futures weekly, at $4,700+ bulls were too exuberant. COT showing expanding speculators, call buying notional close to records seen at the January 26 highs. Monthly chart showing a morning doji star, love my candlestick patterns, with the green up candle overshooting the downside candle from two months prior.
Market kept failing in the overnight session near highs, London and New York never reclaiming them, the first tell-tale of exhaustion going into Core PCE and Jackson Hole. Once headline PCE came in higher than expectations, it seemed hard to see how Warsh couldn't acknowledge that reality, though I was braced for the productivity spin, which his mentor Greenspan was so masterful at, and ultimately so wrong on.
Targets $4,350 to cover some put risk on. I covered some shorts at $4,450 to 90. Premature for sure, even in my spec book I find it hard to remain short for too long, and I'd been fighting most of the week to keep a sizeable short within my risk management tolerance. For once it paid off. A rare victory on the short side.
The weekly market profile hints at a target of $3,750 to 80. See the right-hand side histograms, short histograms are areas the market hasn't traded through, and they can often act as a magnet, pulling price back to fill them.
I'm not in that camp as even an initial sell-off in US equities. Like 2007 to 08, the first 20% downdraft in equities saw gold rally first, before getting caught up in the wholesale deleveraging later in the subsequent 53% correction in the SP500.
And to my mind, gold and silver led the way ahead of bonds and equities, to the downside.
Precious Metals
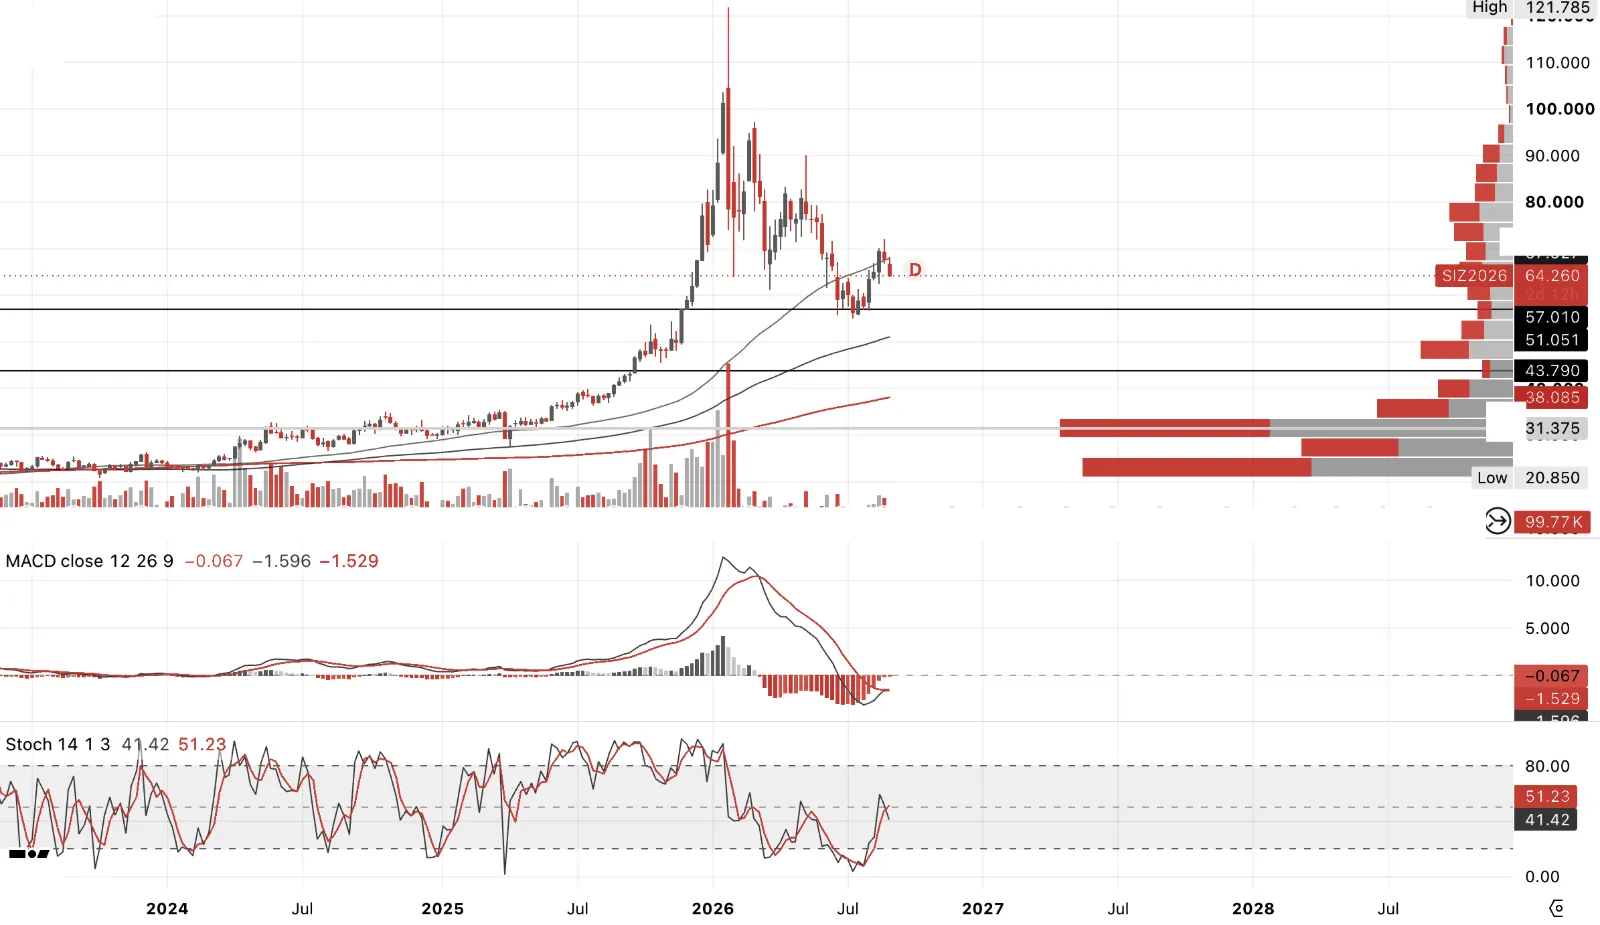
As will see later, the 4hr showed a low-volume thrust break into the JH event, with the GSR having lagged horribly, gold outperforming silver into the lead-up to the PCE release, and JH itself seeing gold sticky bid while silver constantly lost a bid, down to$67.50 many times over, with gold rebounding simultaneously up at $4,640 to 70 on spot.
A crude ABC correction off the highs of 72 takes us to the $61.80/62 zone, though my initial target was $63.25 to 75, which, ahead of NFP, is clearly a decent location off the highs if wanting to be long again.
For me, the GSR chart is showing risk of over 69 on the spread, and that silver will very much get caught up in any SPX-NDX correction is the weight of probability. Though holding long silver vs equities on spread, while volatile, may be a way to play it for some. See later tactical charts at the end.
Precious Metals — Gold/Silver Ratio
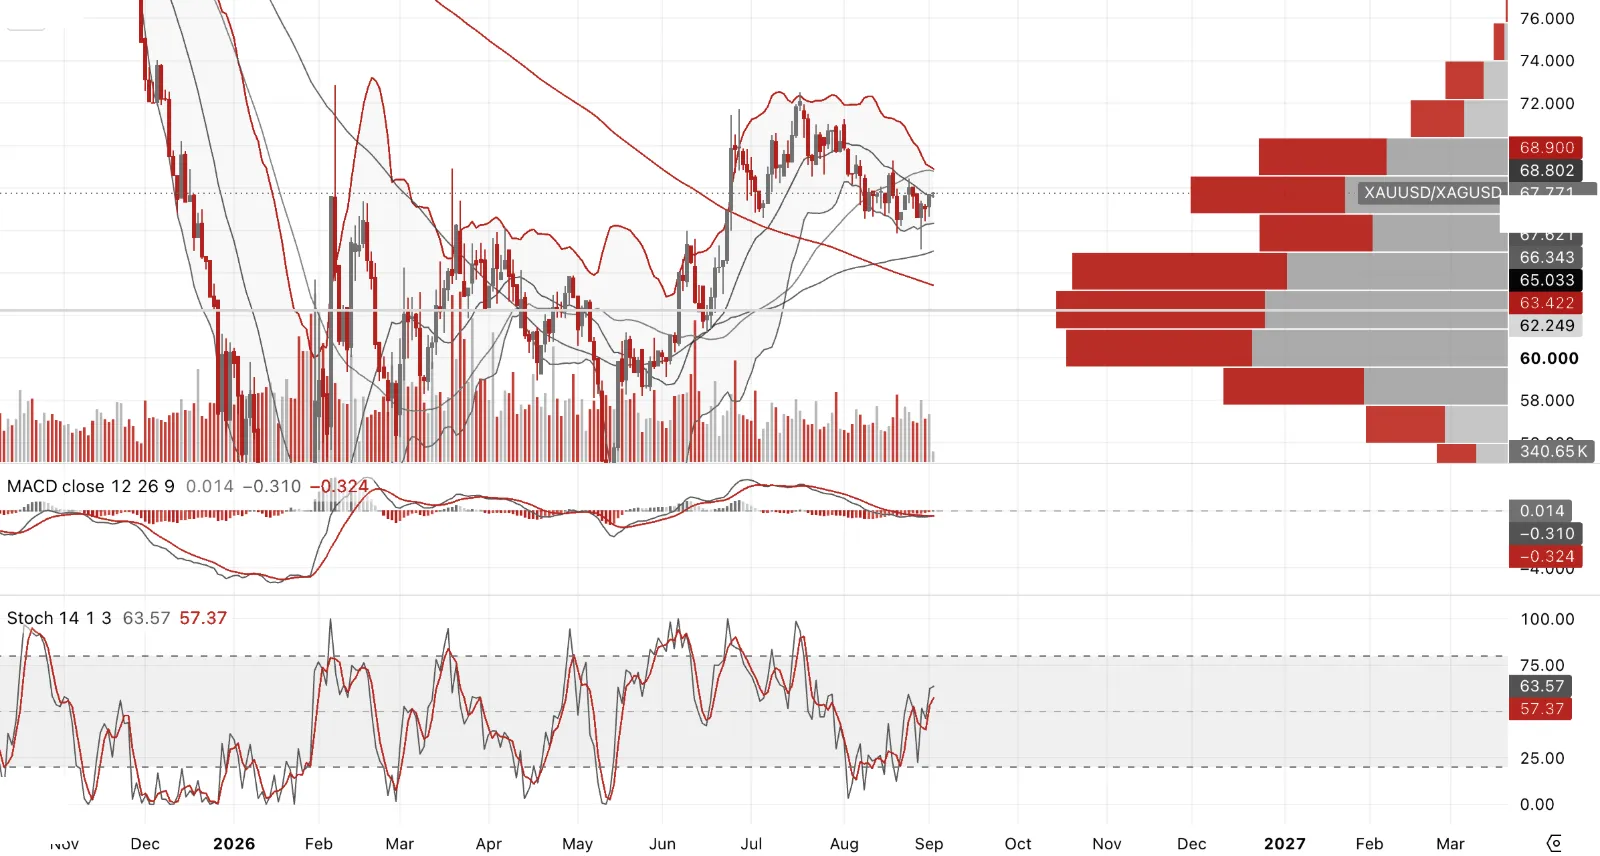
GSR had narrowed from recent wides of 70 down to 65 heading into Jackson Hole. But that headline number was flattering silver. Underneath it, silver had been lagging gold most of the way up, with some genuinely sharp 2.5-point sell-offs in the ratio at times, except for the Bessent UST buyback announcement specifically, which sent gold screaming higher and pulled silver out of a nasty overnight sell-off in Asia. Even then, the GSR blew back out to 68.5 from a 66 handle. Silver may never have actually gotten above 70 on this move.
The physical evidence backs up the doubt. The OTC and EFP data, the best real-time read on genuine tightness in London and CME silver, hasn't shown anything like the stress that drove silver to $118 originally. No 30%-plus lease rates, no 400bps EFP-OTC dislocations, just a market that's normalised. That's not the signs of a market running out of metal near term.
I'm very leery of being long silver against gold until the GSR gets back above 69 and MACD shows genuine positive divergence on that spread narrowing. Though this ratio is often a good way to trade the PMs intra-week, whichever metal has gotten too stretched relative to the other tends to snap back, that's a tactical trade, not a reason to hold a directional silver-over-gold view here.
Precious Metals Producers
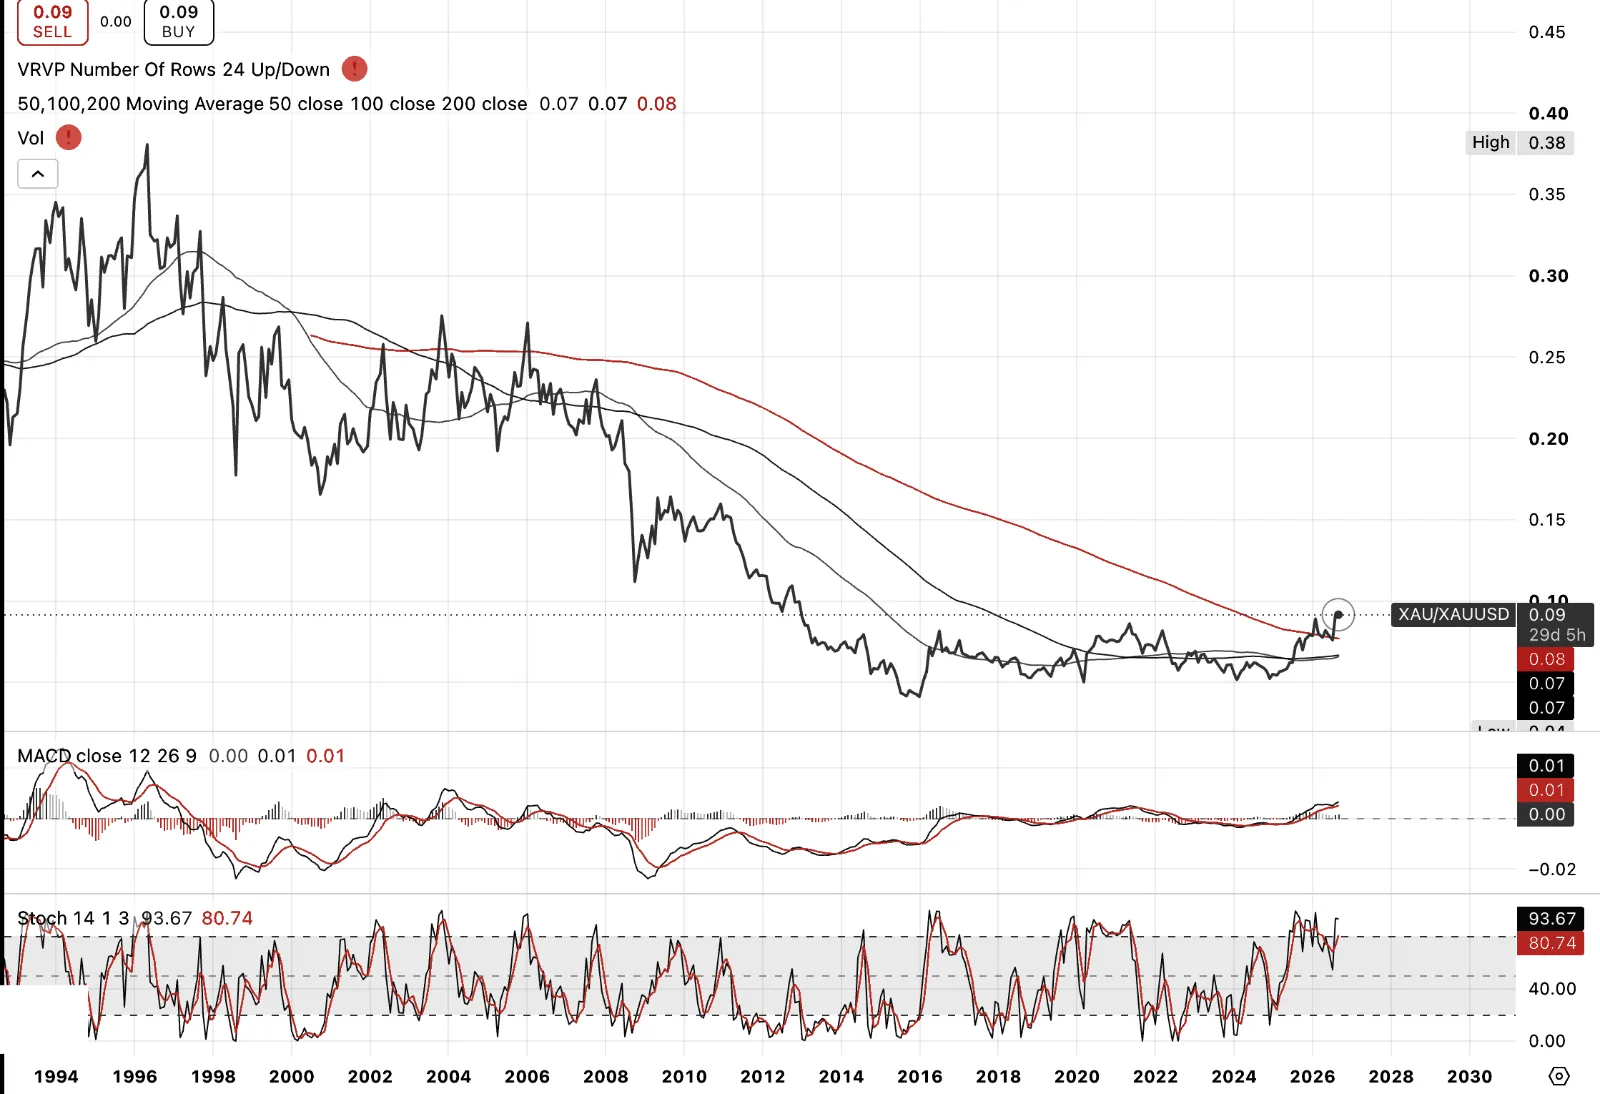
Gold stocks vs gold, breaking out of a consolidatory period of almost fifteen years, spanning two gold cycles. That's the real story here, not the price of gold itself but the market finally re-rating the businesses that produce it. Gold stocks lead. When the miners break out first, the metal usually follows.
The fundamentals back it up. Median profit margins for gold miners now sit at 31%, the highest of any sector in the S&P 500, tech included. Free cash flow is running at records across the majors, Newmont posting $7.3 billion for full-year 2025 and already $5.3 billion through the first half of 2026 alone, both Q1 and Q2 individually its best quarters on record, Agnico Eagle posting its best quarter ever, Kinross its fourth straight record. Debt-to-equity has been cut roughly in half. This is a completely different animal from the sector generalists learned to avoid for thirty years, miners plowing every extra dollar into overpriced acquisitions at cycle tops. This cycle, it's buybacks and balance sheet repair instead.
Precious Metals Producers
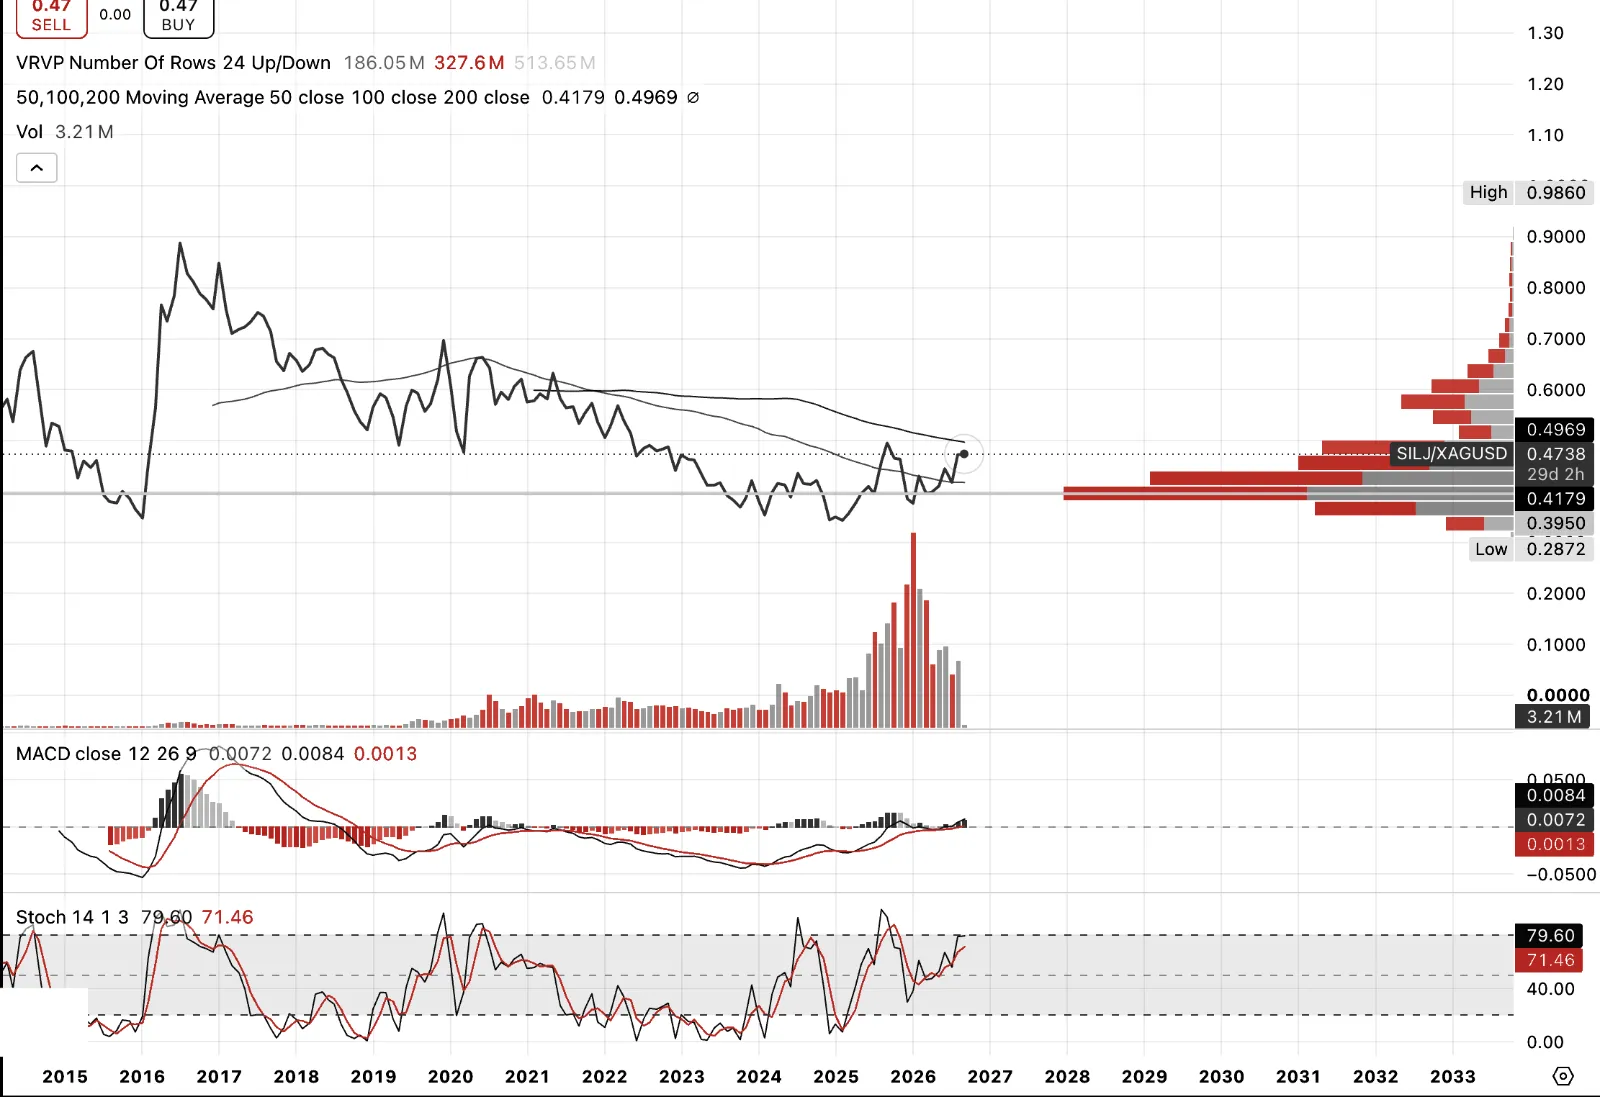
SILJ vs silver, similar story to the gold miners, though silver itself is still a long way off its highs, down roughly 45% from the January 2026 peak near $118 versus current levels in the $60s. That gap is exactly the point.
Silver producers' all-in sustaining costs are running at $12.21/oz on the Silver Institute's own global average for 2025, the lowest since 2022. At current silver prices that's a margin of $45-plus an ounce, the widest in the industry's recorded history. This is interesting as costs aren’t necessarily catching up to price, it's costs falling while price rises, the best of both directions at once.
Yet the miners haven't caught up to that reality. Silver miners have historically run at roughly three times the metal's move through a full cycle. In 2025, silver rose about 300%, SILJ only around 200%. That's an inversion of the normal relationship, and it's the gap that closes once the market excepts that earnings are remaining high relative to what the cost structure is already showing.
Same conclusion as gold. The miners lead, and right now they haven't even started catching up.
Commodities and the Dollar
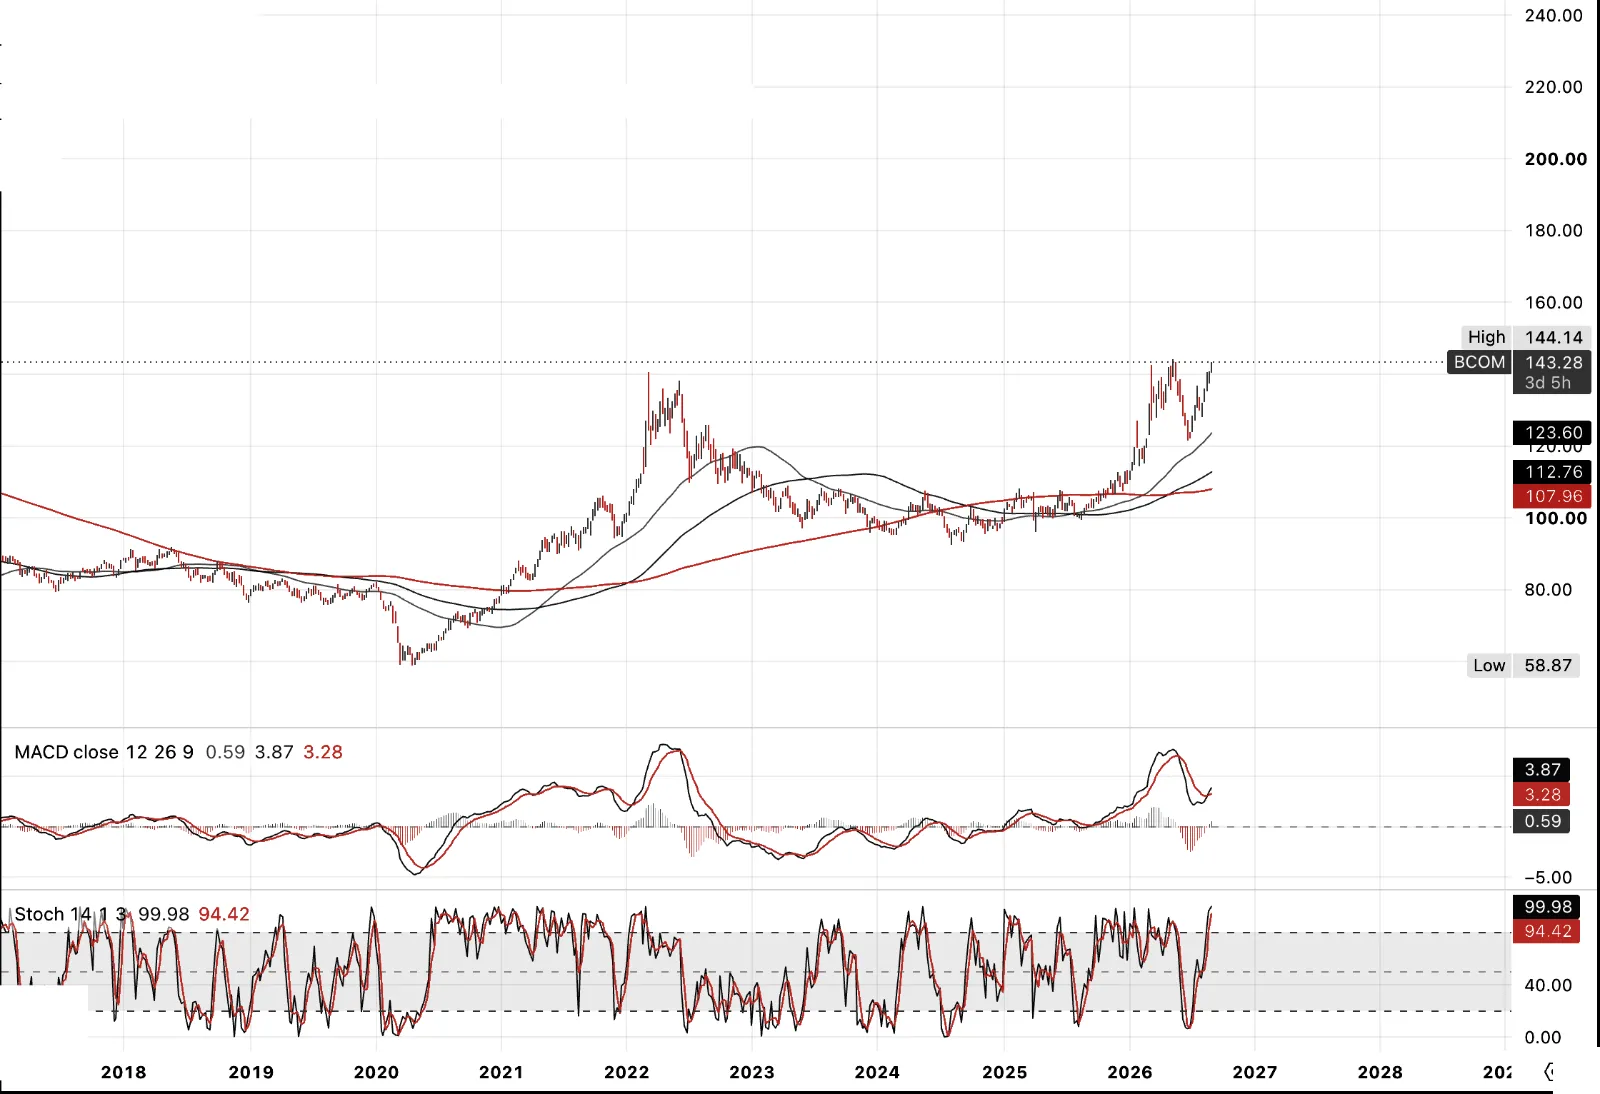
Bloomberg Commodity Index, I believe a secular supercycle is underway. This isn't one sector's narrative, it's geopolitical risk touching every corner of the complex at once.
Start with gold. S&P Global confirms zero major discoveries, 2 million ounces or more, in both 2023 and 2024, the first time that's happened in two consecutive years since records began. Only six major discoveries total since 2020, just 27 million ounces combined, average discovery size down from 7.7 million ounces a decade ago to 4.4 million now. The Aurelians and Redbacks of the world aren't being replaced, a couple of the 10-million-ounce, high-grade discoveries. Exploration spending fell 15% in 2023 and another 7% in 2024, even as prices hit records, the exact opposite of what a functioning market is supposed to do. Of course this will change, and is changing, due to renewal in the sector and FCF, but it takes time to ignite exploration success.
Copper tells the same story through a different mechanism, falling grades compounded by an input crisis nobody was pricing. Chile produces roughly a quarter of the world's mined copper and depends on imported sulphuric acid to leach it, more than a third of that from China. China banned acid exports from May 2026 to protect its own fertiliser industry, on top of a Middle East conflict that choked global sulphur supply through the Strait of Hormuz. Chinese acid shipments to Chile hit zero in March, the first total stoppage since 2023. Morgan Stanley puts over half of Chile's refined copper output at risk. That's not even a grade issue or a demand one, it's a single feedstock chemical nobody thought about until it vanishes, unless you are a producer of said copper. (Robert Friedland).
The substitutes aren't clean either. Aluminium, pushed as the EV-transition alternative to copper, runs into the same Middle East supply chain, the region accounts for roughly 8% of global production and took its own hit from the same conflict. There is no simple escape hatch here, the inputs are shared across the whole complex.
Layer on critical minerals and rare earths, China restricting exports as a matter of explicit policy, and potash, still concentrated in Belarus and Russia and still tangled in sanctions years after the fact. Add agriculture, cattle and livestock herds rebuilding slowly after years of drought-driven culling, grains exposed to the same El Niño and climate volatility that's disrupted planting windows repeatedly this decade, and fertiliser inputs squeezed by the same sulphuric acid crunch hitting copper. Softs carry their own version of this, cocoa and coffee both still working through supply shocks that price alone hasn't fixed.
None of this is being met with policy that matches the scale of it. A decade of ESG-driven capital starvation hit exploration and greenfield development across the entire extractive complex at once, right as demand didn't slow down. Add an increasingly isolationist, protectionist turn from both Washington and Beijing over the metals that matter most, and you have a policy environment actively worsening a supply problem it barely acknowledges.
A significant deleveraging event, if equities crack the way this whole page suggests they might, would pull commodities down with it, no sector is immune to a genuine liquidity event. But that pullback wouldn't fix any of the underlying supply constraints, it would just remove capital from a sector that already can't fund enough new supply. It sows the seeds for the next leg being larger and more violent than this one, not smaller.
Commodities and the Dollar
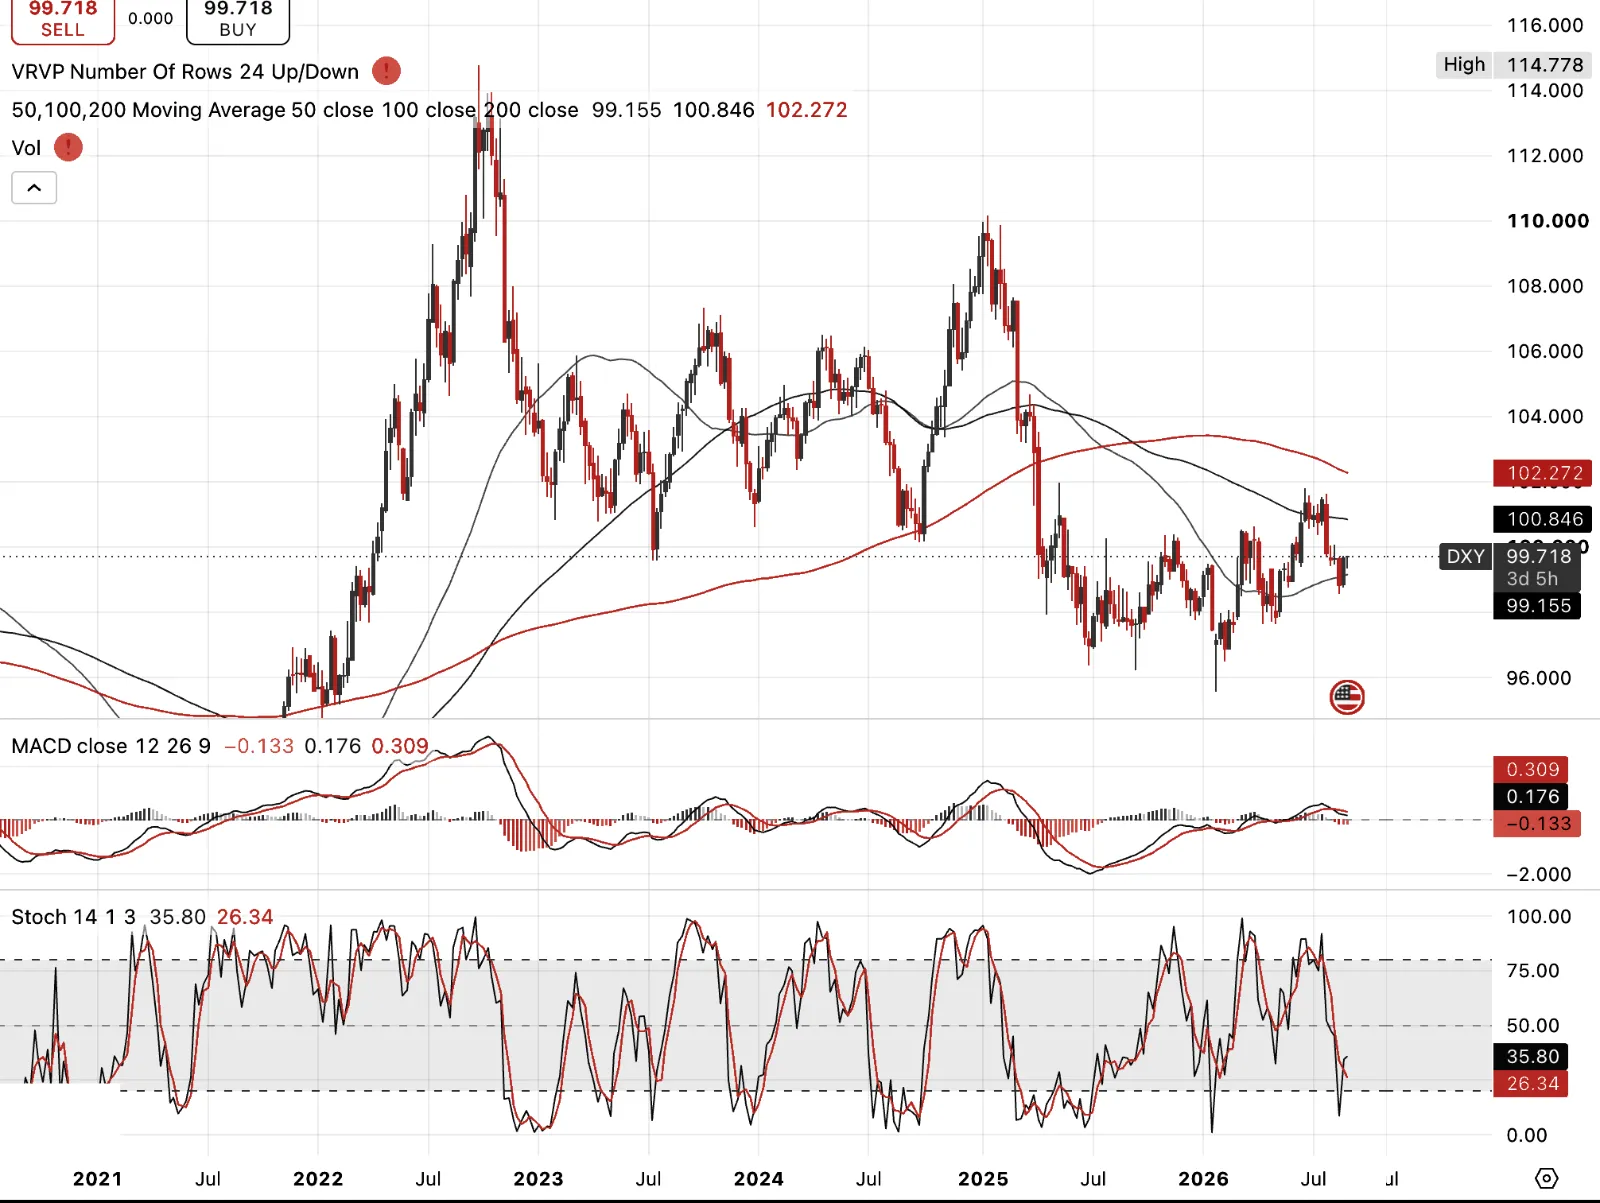
DXY, and here's the tension. Fiscal incontinence is a recipe for dollar decline over the medium term, that's the structural case and I hold it. Protectionism and tariffs upend the trade and capital account balance the dollar's reserve status has always depended on, the US can no longer assume strangers will keep funding the twin deficits, especially while pulling back from being the world's policeman, Japan being the one clear exception, the Pacific bases there are too strategically important to walk away from.
But structural and immediate aren't the same trade. A correction and a genuine tightening in financial conditions, which I think we're about to get a whiff of, means dollar shortages, not dollar abundance. That's what a real deleveraging event does, it forces a scramble for the currency the world's debts are denominated in, regardless of the long-term fundamental case against it. I'd watch for DXY over 101, and if this gets properly nasty, 105 is not an unreasonable target.
Positioning supports this. CFTC data showed speculative dollar shorts at their most extreme level in over a decade, only recently starting to unwind. Too many people are already in the debasement trade. That's exactly the kind of crowding that gets squeezed hardest when the tightening actually arrives.
Crack Spread
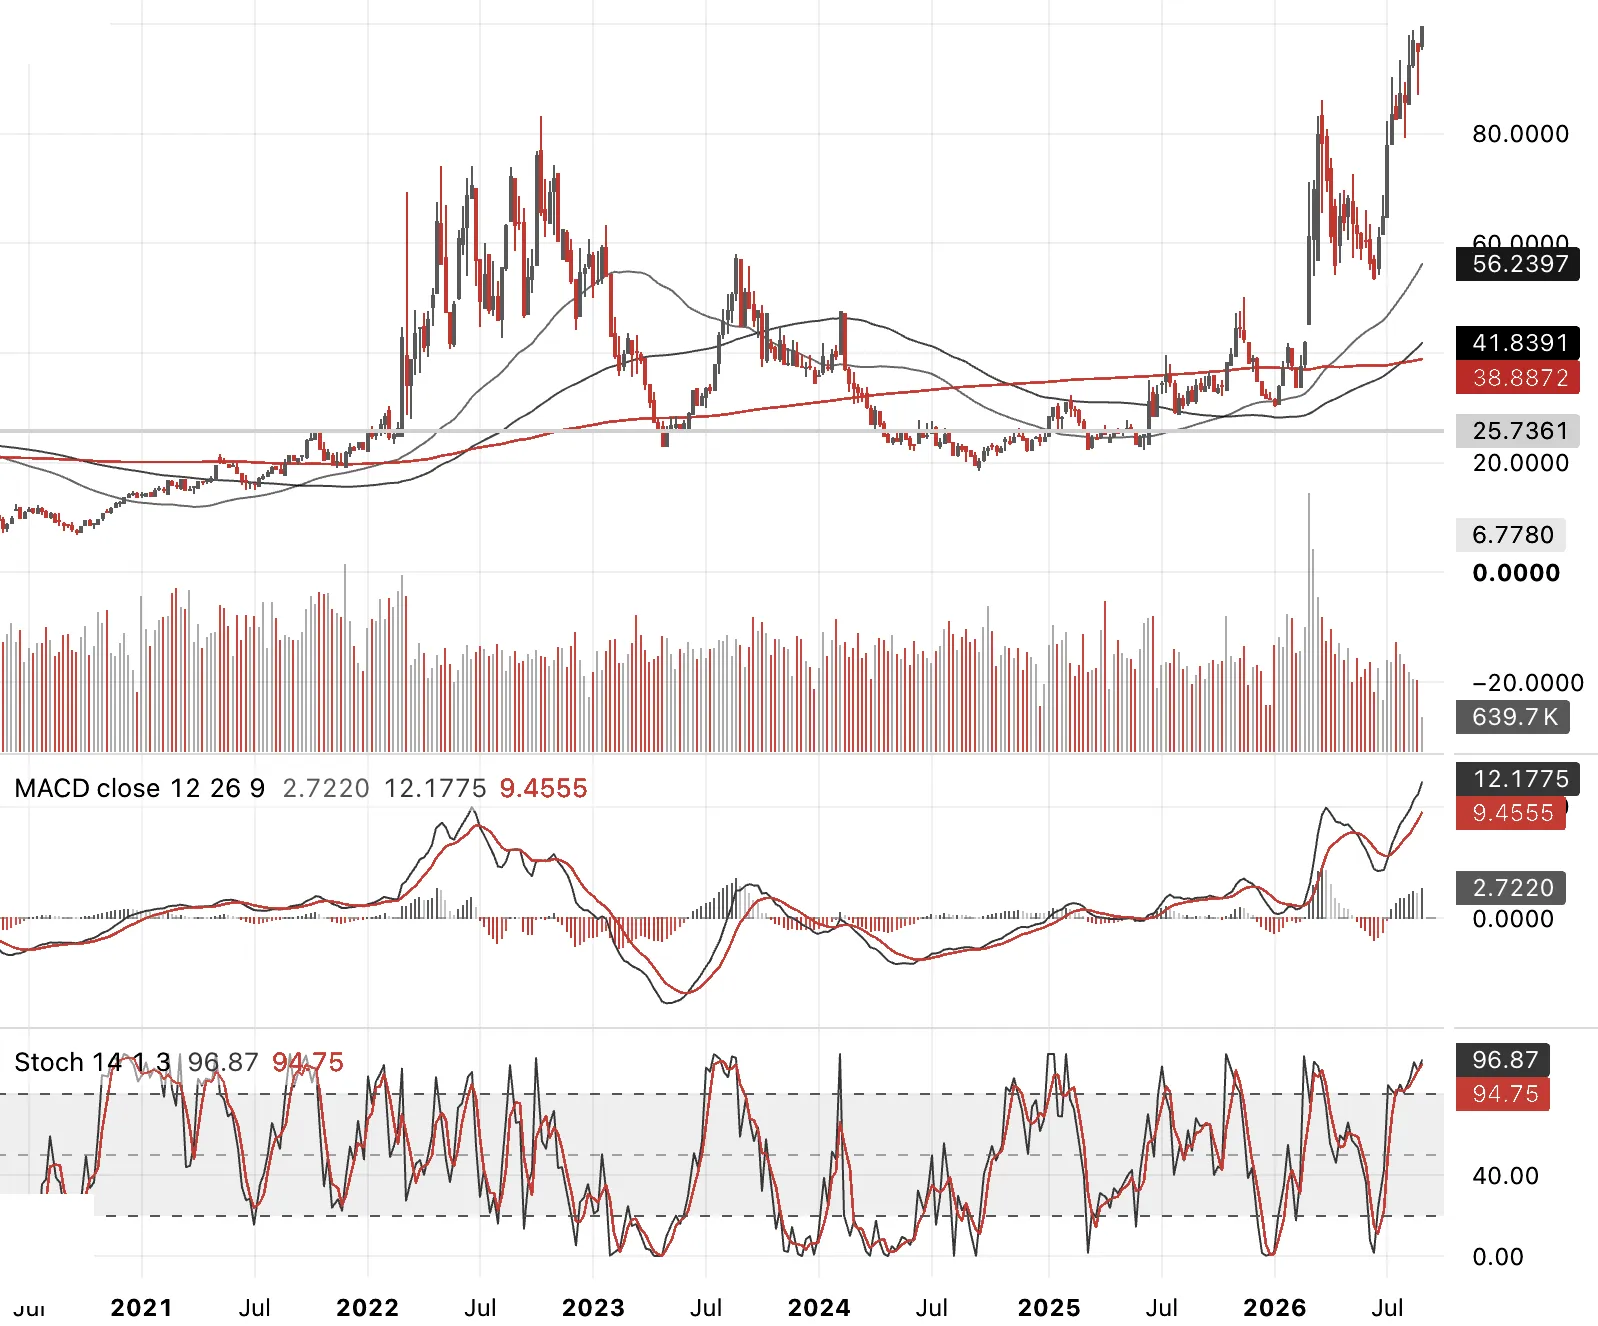
Crack spread, 1 to 1. Quick explainer, a crack spread is simply the price of a refined product minus the price of the crude that made it, refiners "crack" crude into diesel, gasoline, jet fuel, and the spread is what they earn for doing it. The common version is the 3:2:1, blending gasoline and distillate together. I'm showing it 1 to 1 here, isolating distillates specifically against crude, because that's where the real issue is, not crude itself.
And the evidence is stark. Diesel refining margins hit a record $102 a barrel on the Gulf Coast in August, still running $93-94 now, even as Brent sits more than 26% below its April peak. That gap is the whole issue. This isn't crude scarcity, it's refining capacity that has been permanently destroyed, seven US closures since 2019 with no new capacity built, global refinery output down over 5% this year alone from closures and war damage.
This is what real second-round inflation looks like. It's at the pump, it's in home heating, and it's in manufacturing, chemicals and plastics both run on distillate derivatives, not on the crude price you see quoted. And because the constraint is physical refining capacity, not the oil itself, these costs can keep rising even if crude sits still or falls further. You can't build a refinery in a quarter. This one doesn't resolve on the same timeline as the crude price does.
Diesel and Natural Gas
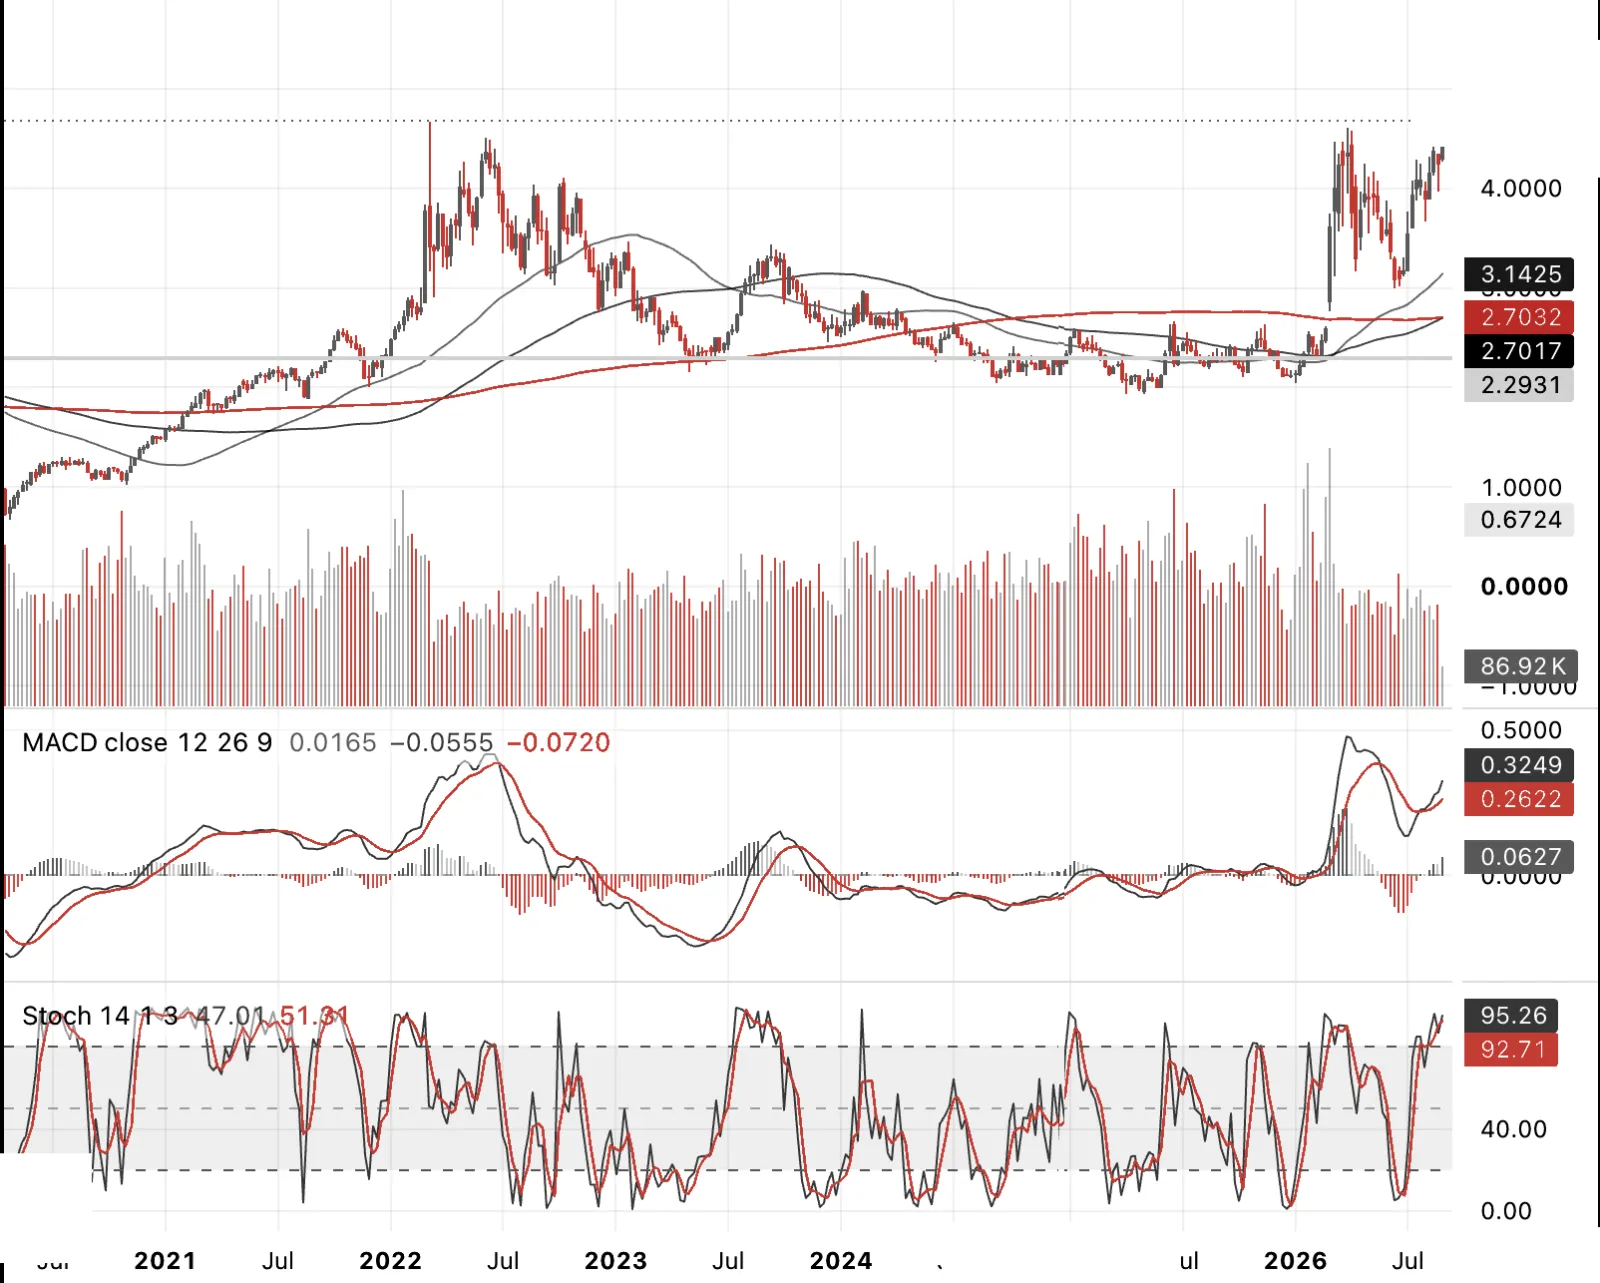
ULSD futures, the sharp end of everything just discussed. This is the actual price the crack spread translates into at the pump and in home heating oil.
National average retail diesel was $4.796 a gallon back in July, and that was with crude well off its highs. This is the chart that shows whether relief at the crude level is actually reaching consumers, and right now it isn't. This is the US, but across Europe a similar theme on pricing in the home for natural gas and generated electricity exists.
Diesel and Natural Gas
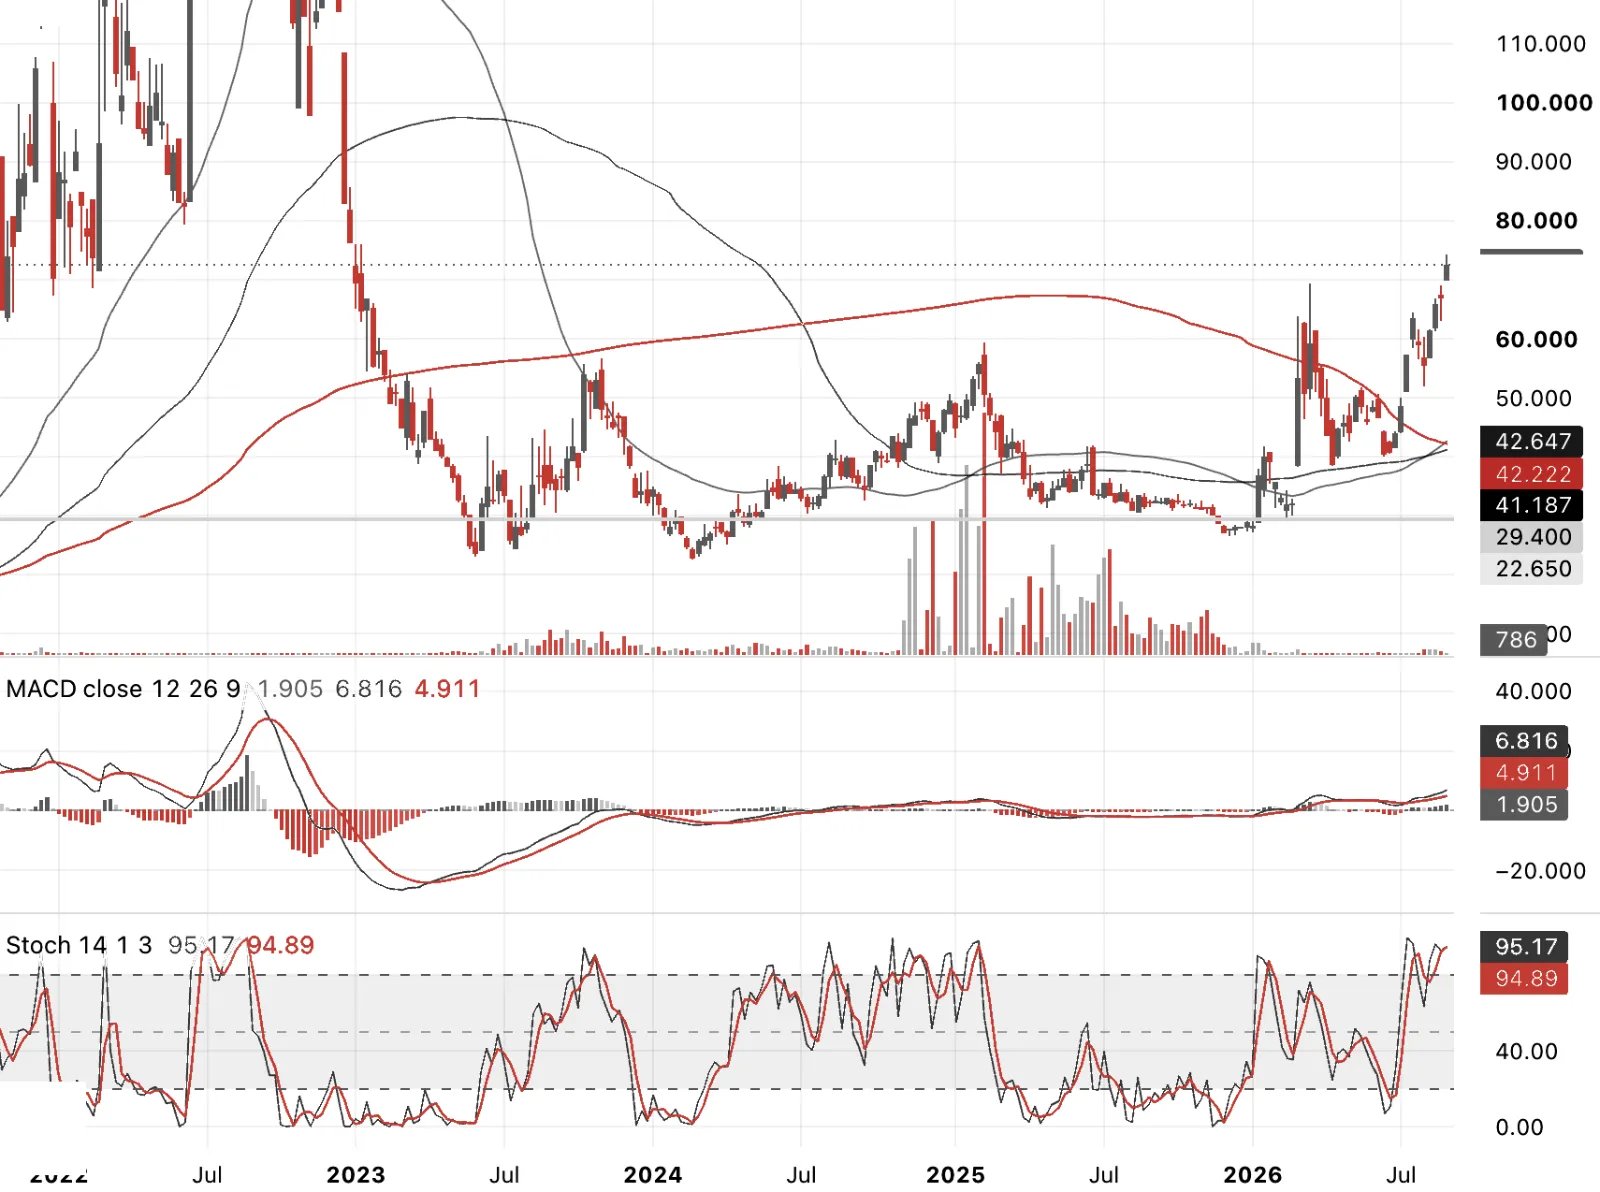
A related theme is playing out across Europe on natural gas and electricity. European natural gas (TTF) has surged roughly 120% since the start of 2026, hitting €69-71.5/MWh as of this week, the highest since January 2023, driven directly by the same root cause as the diesel story, the Iran conflict and Strait of Hormuz disruption hitting LNG export flows, on top of a summer heatwave pulling gas into power generation exactly when storage should be rebuilding for winter. So the underlying shock really is the same one rippling across continents.
What differs is that the US diesel story is specifically about refining capacity decoupling from crude, a processing bottleneck. The European story is more direct, gas itself is expensive because of the supply shock, and it passes through to electricity via the "merit order" system, where gas plants set the marginal price for power most hours of most days. There's also a genuine lag built in, ACER data shows an average 59% of EU households (100% in several countries) sit on regulated or fixed-price contracts that only renew every one to three years, so the pain arrives with a delay rather than a refining-margin-style structural wedge.
Yen Crosses
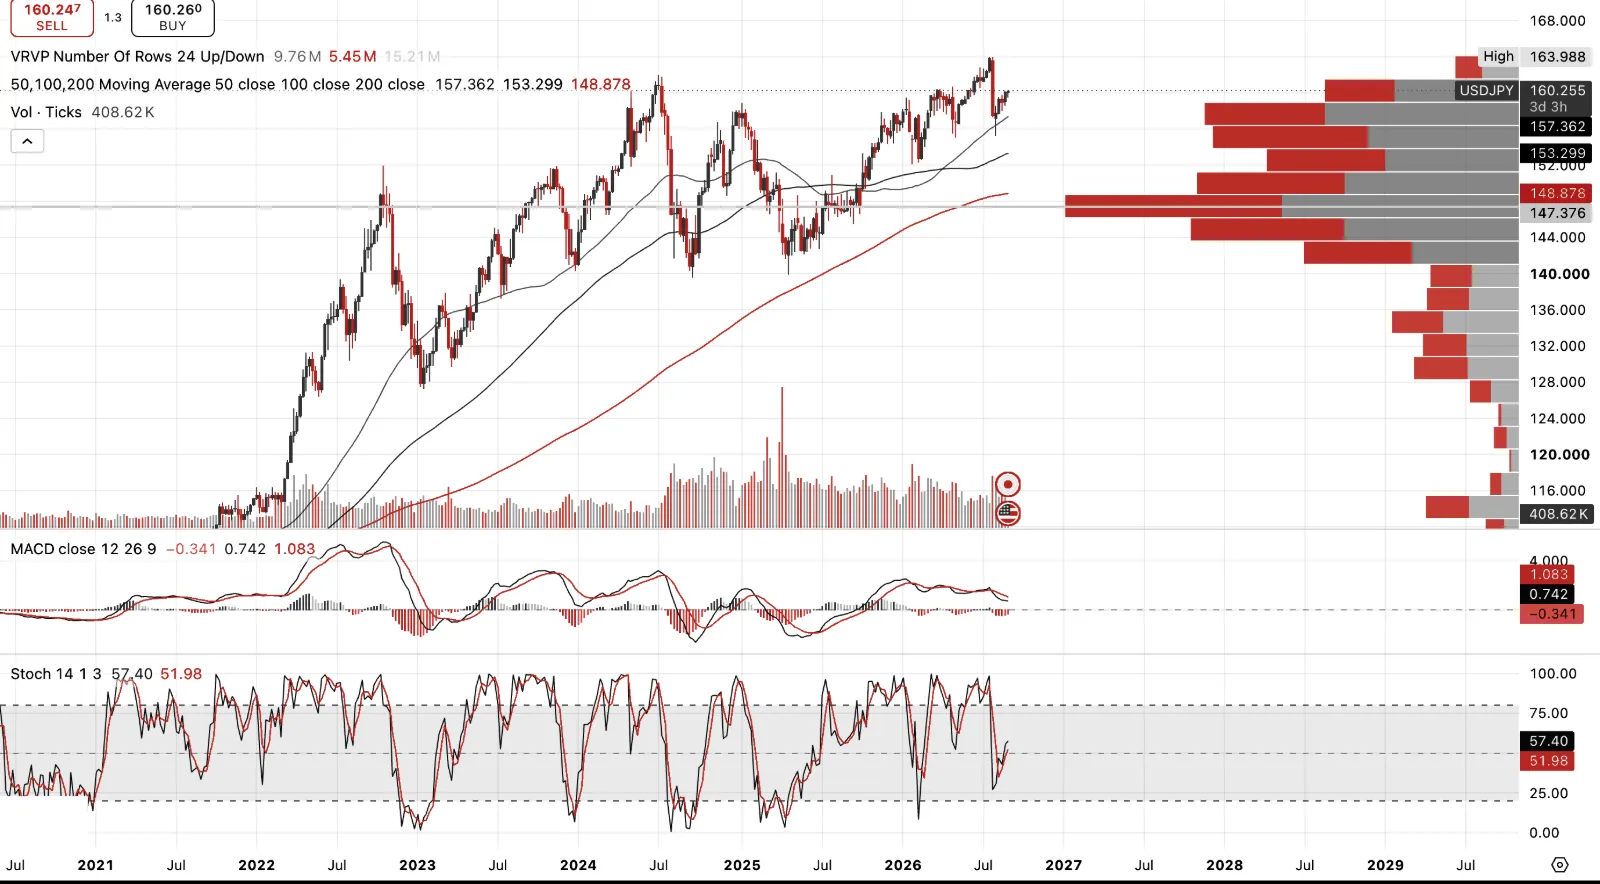
USD/JPY. It's hard to overstate how important this cross is to global markets right now, everything we've covered on JGBs runs through here. Japan was the marginal buyer of duration worldwide for a decade, funded by a weak yen making foreign bonds cheap to buy. A stronger yen doesn't just move a currency pair, it potentially pulls that capital home.
On the intervention itself, Japan spent roughly $59 billion solo on July 30, up to $85 billion across July 30-31 by Goldman's estimate, its largest two-day intervention outside of 2011. The US joined on August 3, the first joint intervention since 1998. And yet USD/JPY is back at 160 today, essentially round-tripping the whole effort. That tells you something on its own.
Will it work? It can, but only if the mechanism changes. Intervention alone just buys time, Goldman said as much themselves, it doesn't touch the actual cause, which is the rate differential. If Japan raises rates and that differential genuinely narrows, without choking off growth in the process, this holds. If it's intervention alone doing the work, it fails the same way it's already started to.
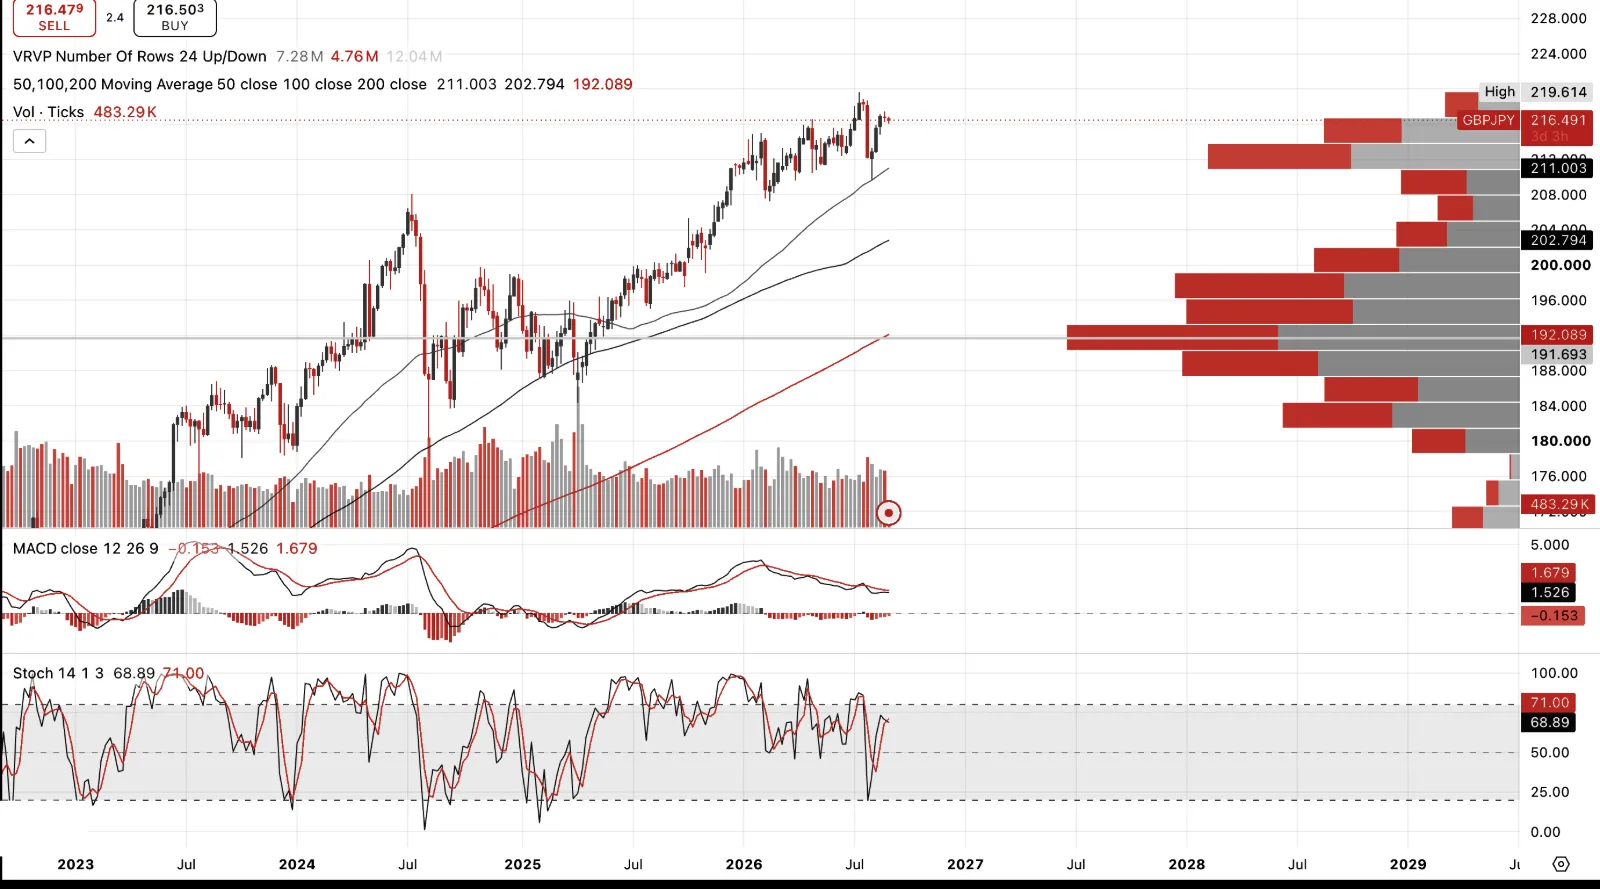
GBP/JPY. I'm dollar bullish here while leaning toward yen strength on the BoJ hiking story, so I wouldn't want to be long this cross. Sterling's own mess, gilts at 2008 highs, Burnham under real fiscal pressure heading into his first budget, argues for GBP weakness on its own terms. Pair that with a yen I expect to strengthen and you're leaning on both legs to work against you at once. Not a place I want to be positioned long, whatever the carry looks like. There are easier trades to be had.
The Euro
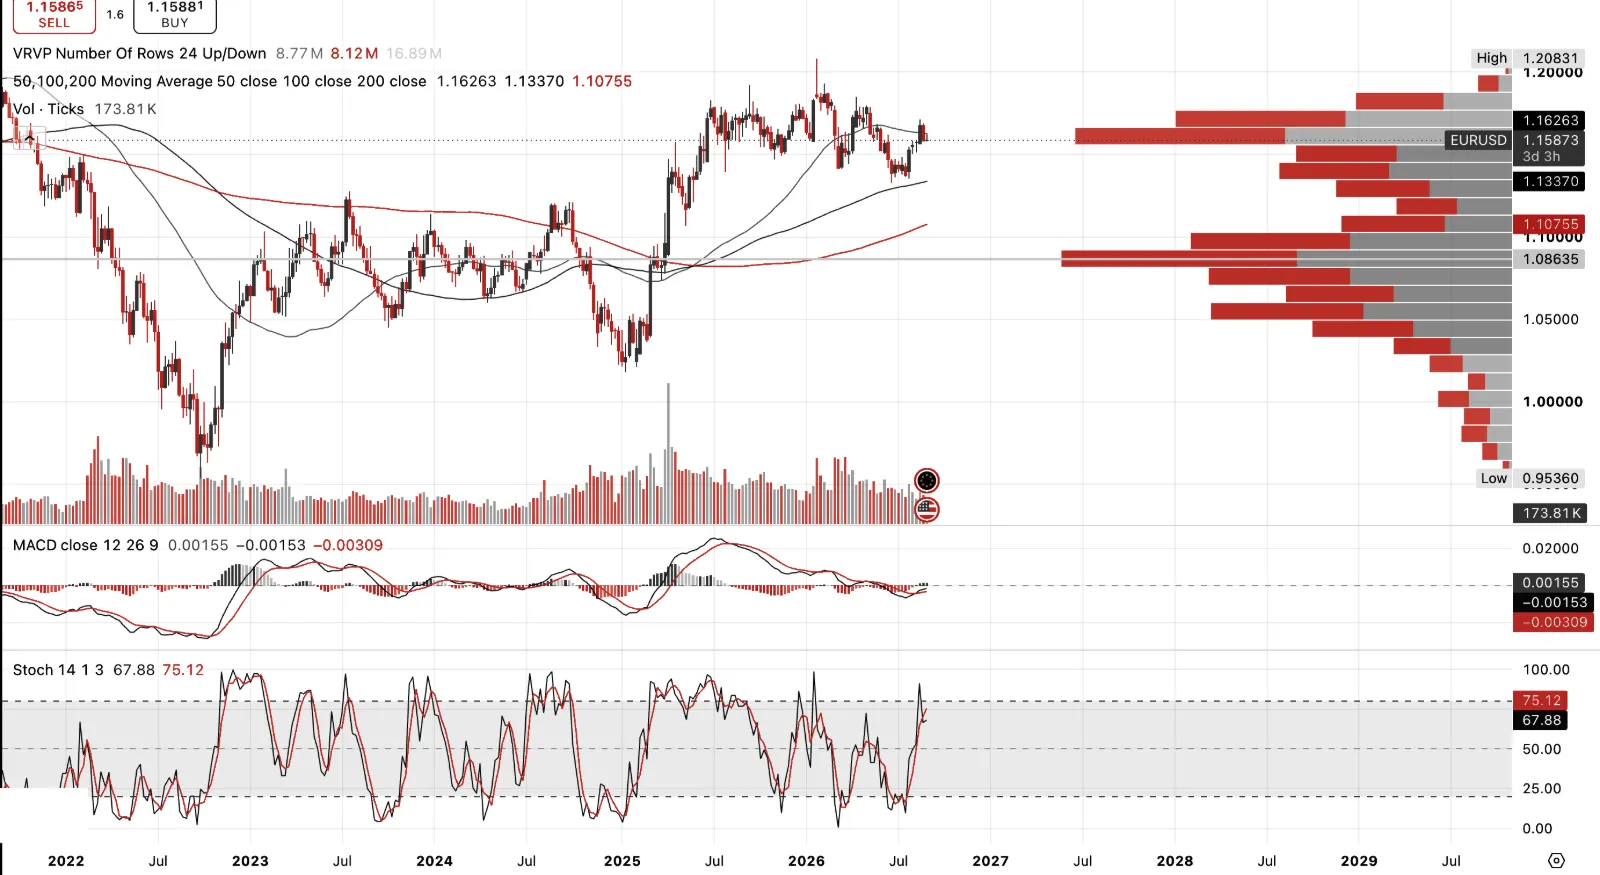
I watch DXY and EURUSD as a pair for non-confirmations at turning points.
US Stocks & Credit Disconnect
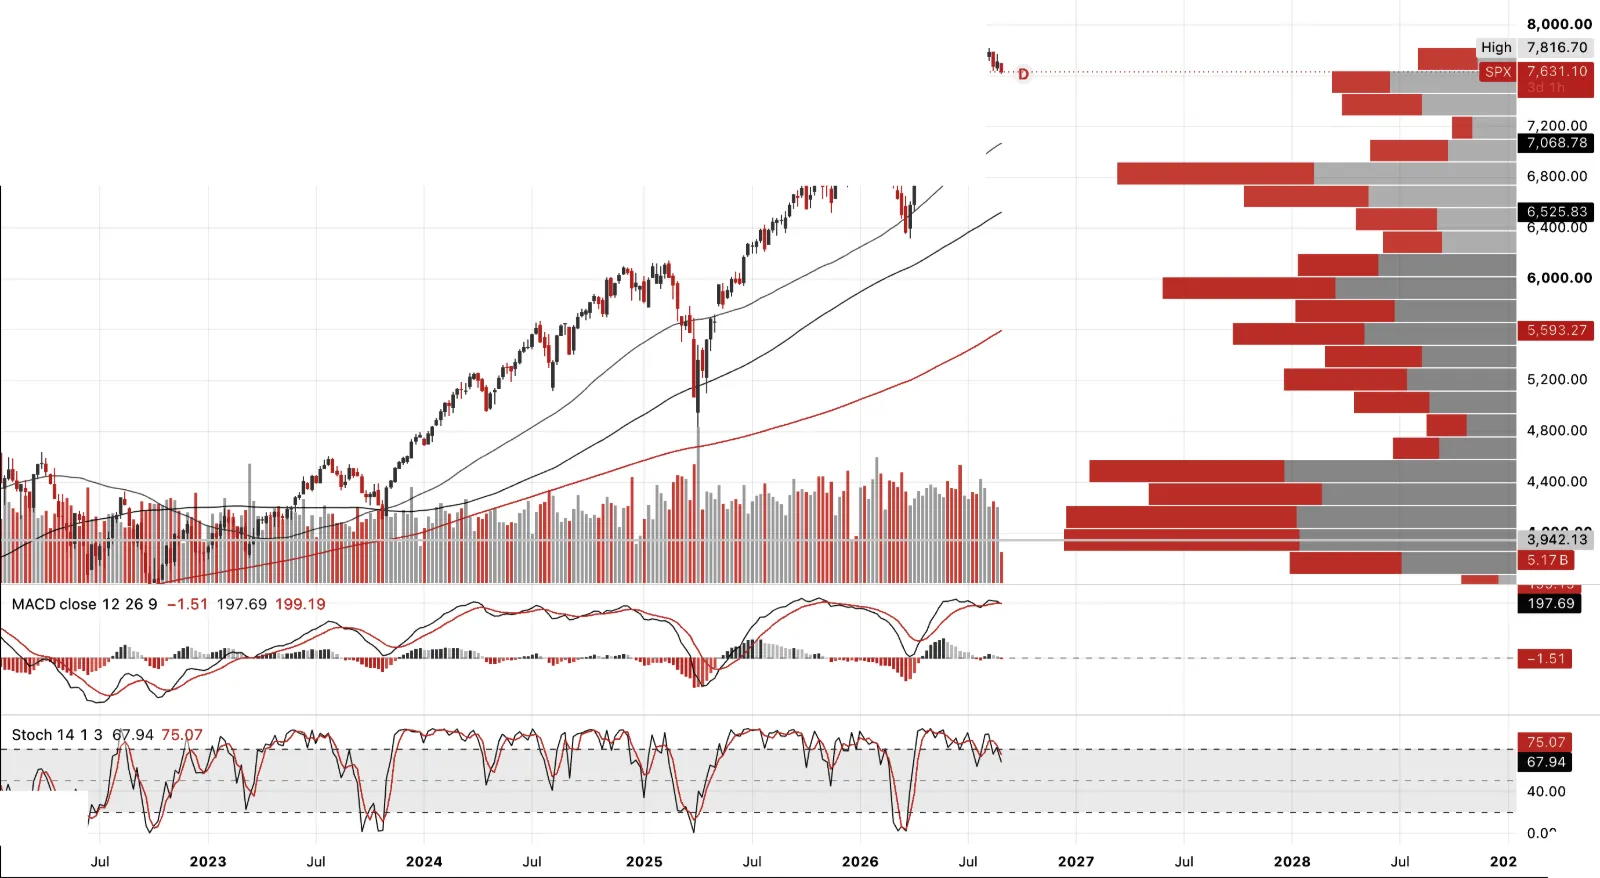
SPX, up close to 19% over the last year and still near highs, even after this week's wobble. That alone isn't the point. What matters is what credit's been doing underneath it, priced completely differently. Oracle's five-year CDS has widened 70 basis points this year to around 215, a multi-year high. Broadcom's up 48, Nvidia's up 32 to its widest level since the contract started trading. Hyperscaler bond spreads have widened across the whole curve, short paper, belly, long end, all moving the same direction. Equities have kept rewarding AI capex. The market that actually insures the debt behind it has been charging progressively more to do so. That's the disconnect, and credit is usually right.
US Stocks & Credit Disconnect
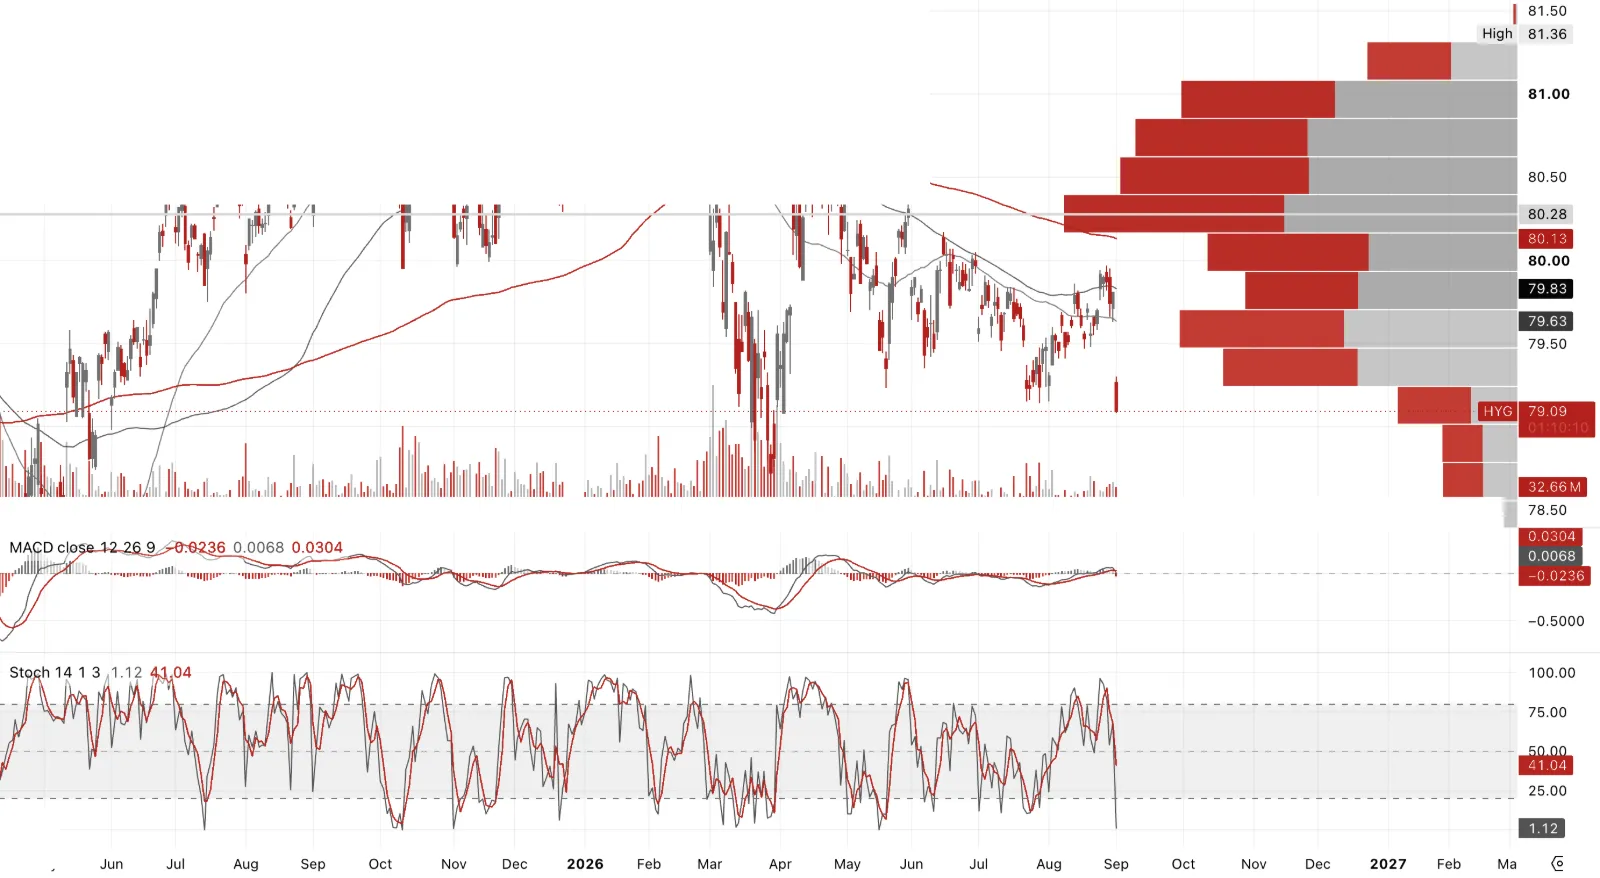
iBoxx, the same disconnect from the other side. This is the broad investment-grade tape, not just the AI-adjacent names, and it's still where you'd expect a market this late in a cycle to be, spreads historically tight, priced like nothing's wrong.
That's exactly what makes the individual widening in Oracle, Broadcom and Nvidia worth watching closely. It isn't showing up in the index yet. Credit stress nearly always starts as a single-name move before it becomes market-wide, and right now that's precisely the stage this looks like it's at.
Note on Dow Theory
The following equity charts are also worth viewing through the lens of Dow Theory. At its heart, Dow Theory holds that the market discounts the future and that a genuine primary trend should reveal itself through confirmation across economically related parts of the market. Charles Dow originally looked for confirmation between the Industrials and the Railroads. If industrial companies were prospering, the companies transporting their goods should ultimately be telling the same story. A failure to confirm was not itself a sell signal, but it was an important warning that the headline index might not be telling the whole story.
The particularly clever aspect of Dow Theory is that this principle can be extended far beyond the original Dow averages. The question is simply whether the market underneath is confirming the headline price. Today we might look for confirmation—or divergence—between equities and credit, the S&P and transports, semiconductors and the broader market, AI equities and the bonds financing the AI build-out, or gold and the mining shares. In other words, apparent strength in one market becomes more credible when the economically connected markets confirm it; persistent non-confirmation tells us to look more closely.
This is especially relevant to the charts that follow Next month I will return to Dow Theory in more detail, including the legendary Richard Russell and his Dow Theory Letters, one of the longest-running investment letters in market history. Russell's great contribution was to treat market action not merely as technical analysis, but as a means of diagnosing the underlying economic, monetary and credit cycle.
US Equities
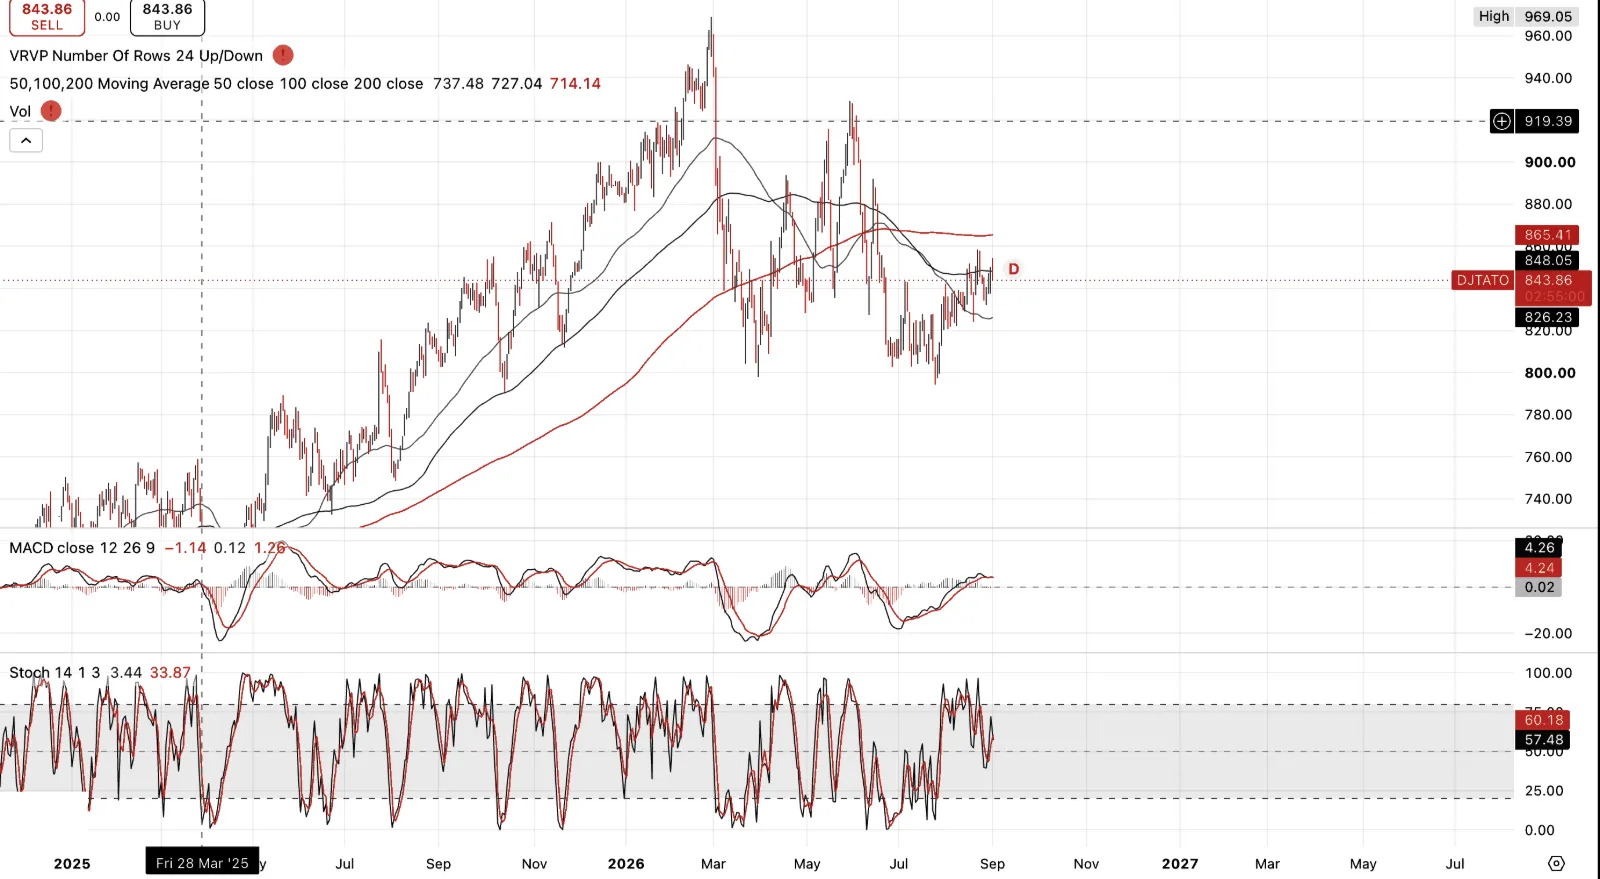
DJ Automobiles & Parts Titans 30, my stand-in for the transports leg of Dow Theory, and the non-confirmation here is textbook. This index topped near 969 in March 2026. The second attempt in April/May couldn't even get back there, stalling out near 919, a lower high. From there it broke down hard into the 750s by mid-summer, and even the recent recovery back to 843.86 leaves it well below both peaks.
DJIA did not confirm any of this. It kept making new highs through the same stretch. That's precisely the warning Dow himself would have flagged, not a sell signal on its own, but a genuine divergence between the headline average and the economically connected market underneath it.
Worth remembering while looking at this pair specifically, the DJIA is price-weighted, not cap-weighted and not equal-weighted, a quirk unique to the Dow. A handful of expensive names can carry the average to new highs while the broader market, and clearly this one, isn't agreeing at all.
US Equities
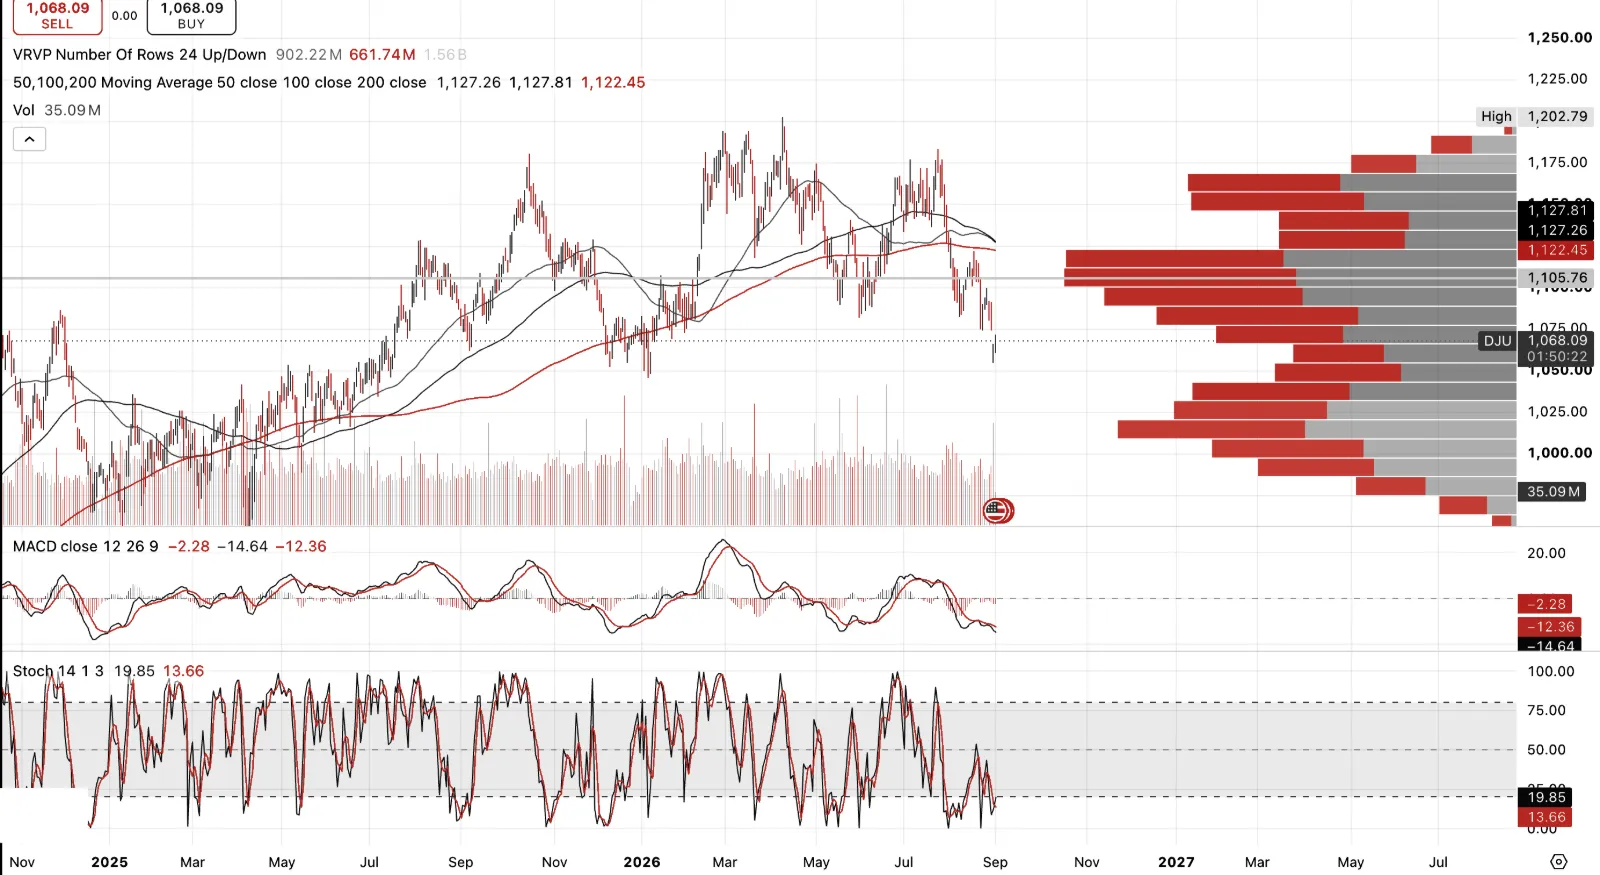
Dow Jones Utility Average, the classic third leg of extended Dow Theory alongside Transports, and it's telling the same story as the Autos & Parts Titans chart. DJU hit a high of 1,202.79 in early 2026, failed to hold it, made one more attempt at a similar level months later, and has since broken down to 1,068.09, roughly 11% off that high, with its 50-day average now crossing below the 100-day.
DJIA confirmed neither of these. Not the transports proxy, not the utilities. Two of the classic confirming legs both topped out and rolled over months ago while the headline average kept making new records through the same period. This is not a single index behaving erratically. It is the breadth of non-confirmation that Dow Theory was formulated to identify.
Taken together with the Autos & Parts chart, the argument carries considerably more weight. One non-confirming index is an anomaly. Two, moving in the same direction and independently signalling the same thing, is precisely the divergence Richard Russell spent a career instructing investors not to disregard.
US Equities
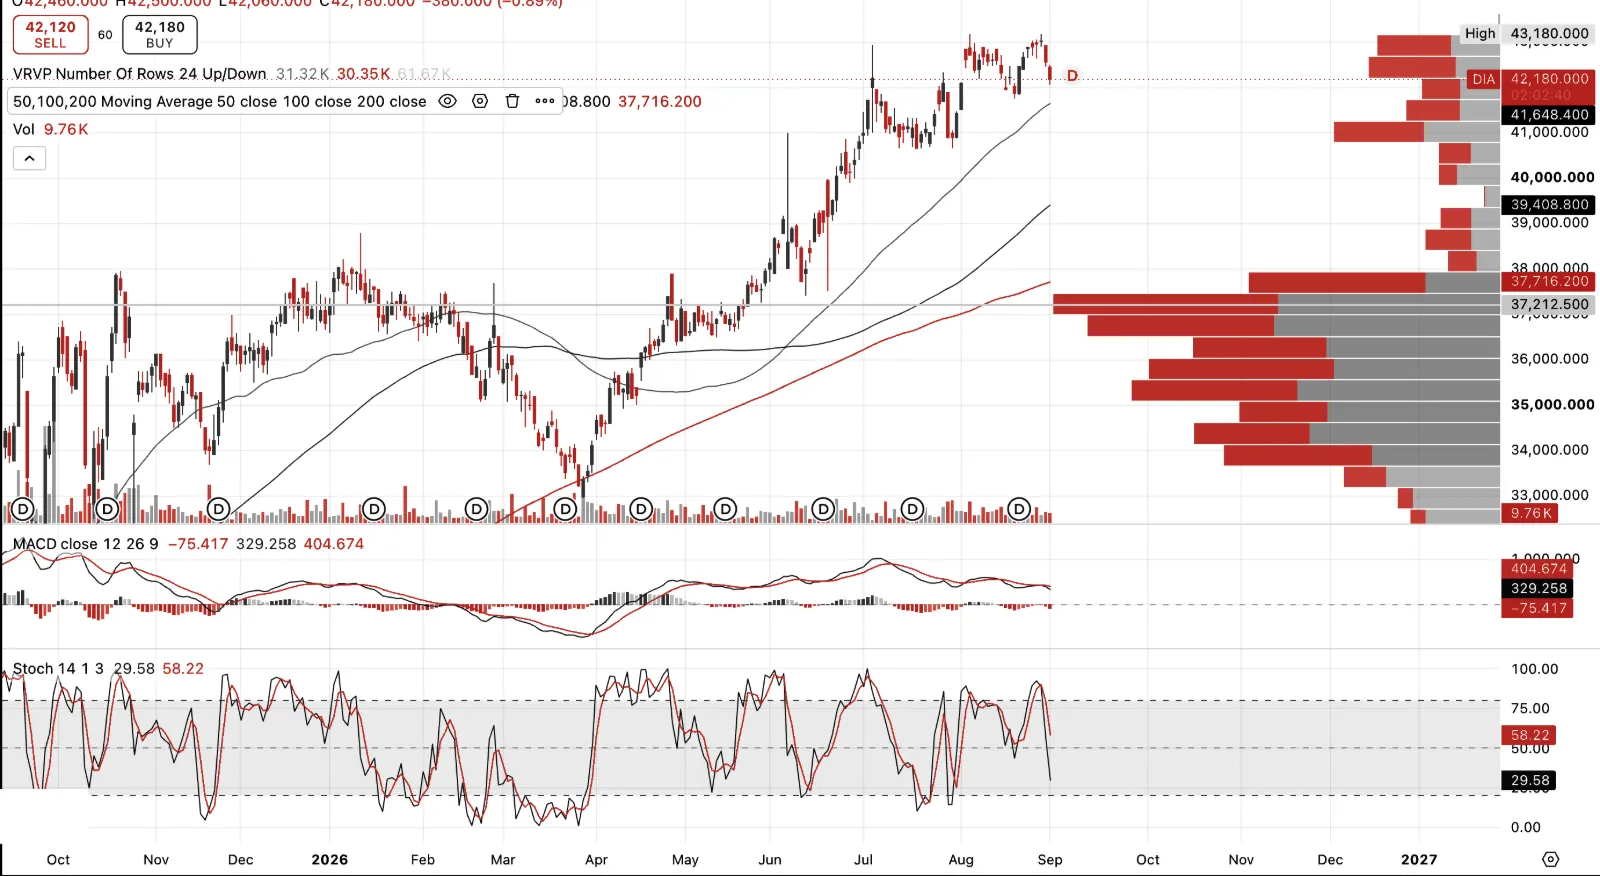
Dow Jones Industrial Average, and this is what makes the non-confirmation real rather than academic. DJIA bottomed near 33,000 in April 2026 alongside broad market weakness, then rallied more than 27% in a straight line to a fresh all-time high of 43,180 in August. It did this through the exact stretch where both DJU and the Autos & Parts Titans 30 were topping out and breaking down into lower highs.
Put the three charts side by side and Dow's own test is right there. The headline average making new records, while two economically connected legs, utilities and the transports proxy, both fail to confirm and both roll over months before the top. That's the warning Dow Theory exists to catch, and Richard Russell built a career reading exactly this kind of divergence as a sign the strength in the average isn't as broad as the index level suggests.
Semiconductors and Nvidia
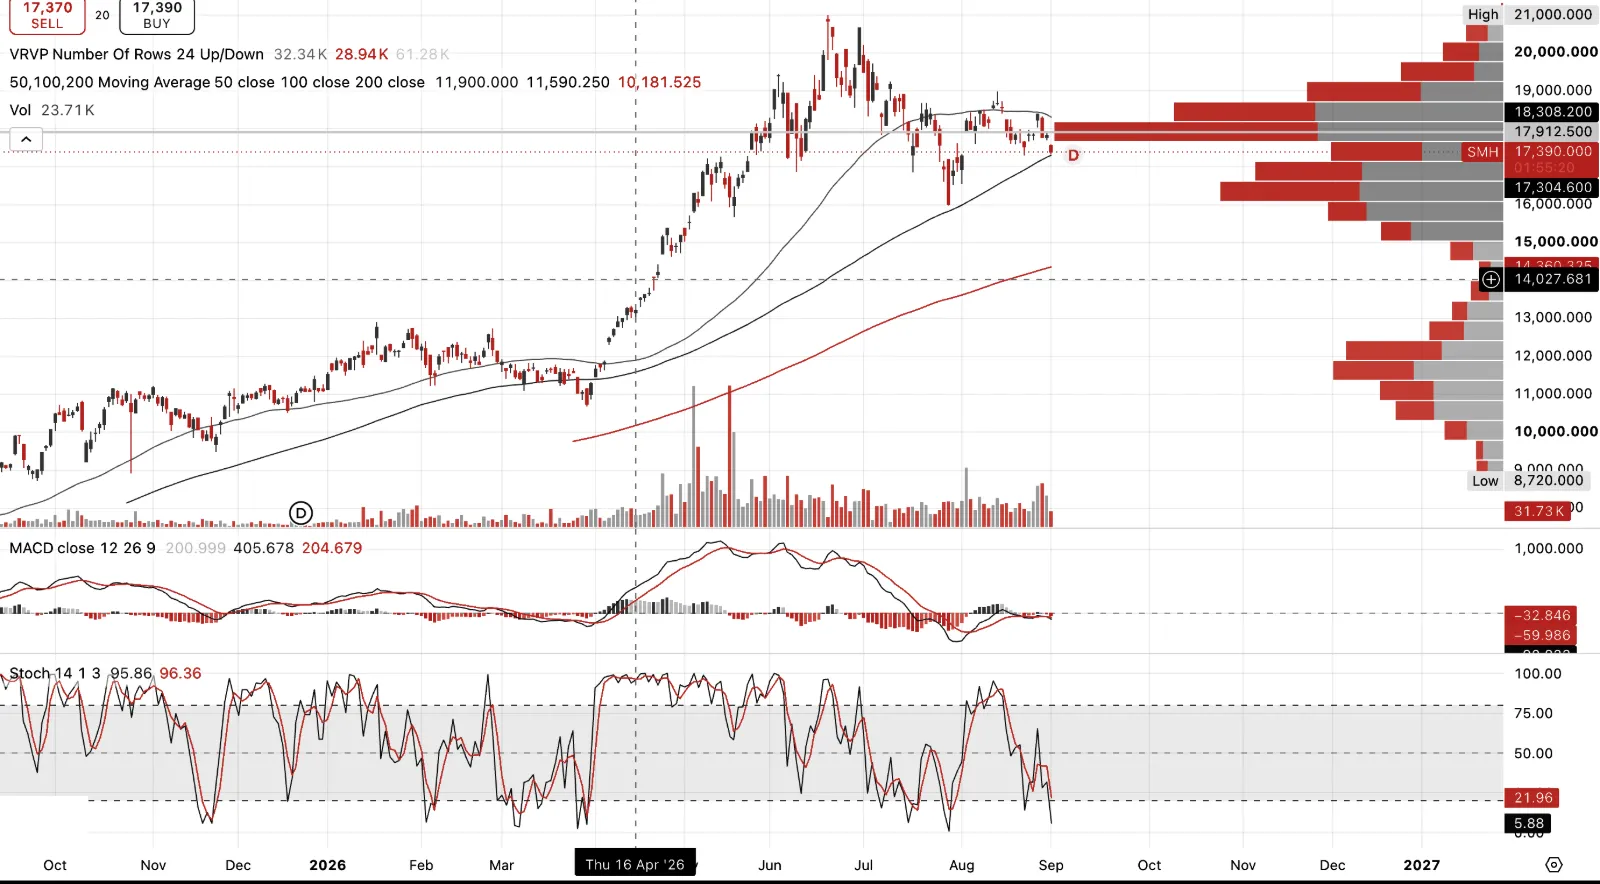
SMH Semiconductors sector. I think of this as an earnings bubble as much as a price one. The July rout was just that, SMH fell nearly 18%, SOXX 21%, and it wasn't random. It coincided almost exactly with the collapse of Situational Awareness, the AI hedge fund run by 24-year-old former OpenAI researcher Leopold Aschenbrenner, ironically named after his own 2024 essay about seeing the future clearly. Running roughly 4x leverage on a concentrated semiconductor book, the fund went from $45 billion to $10 billion in weeks as Sandisk, Micron, Bloom Energy and Nebius all cratered together. Days before the forced sale, Aschenbrenner wrote to investors calling it "some of the most attractive opportunities since early 2025" and asked for more capital. None came. Citadel picked up the $16 billion public portfolio at roughly a 10% discount, an opportunistic bailout dressed up as a rescue.
Semiconductors and Nvidia
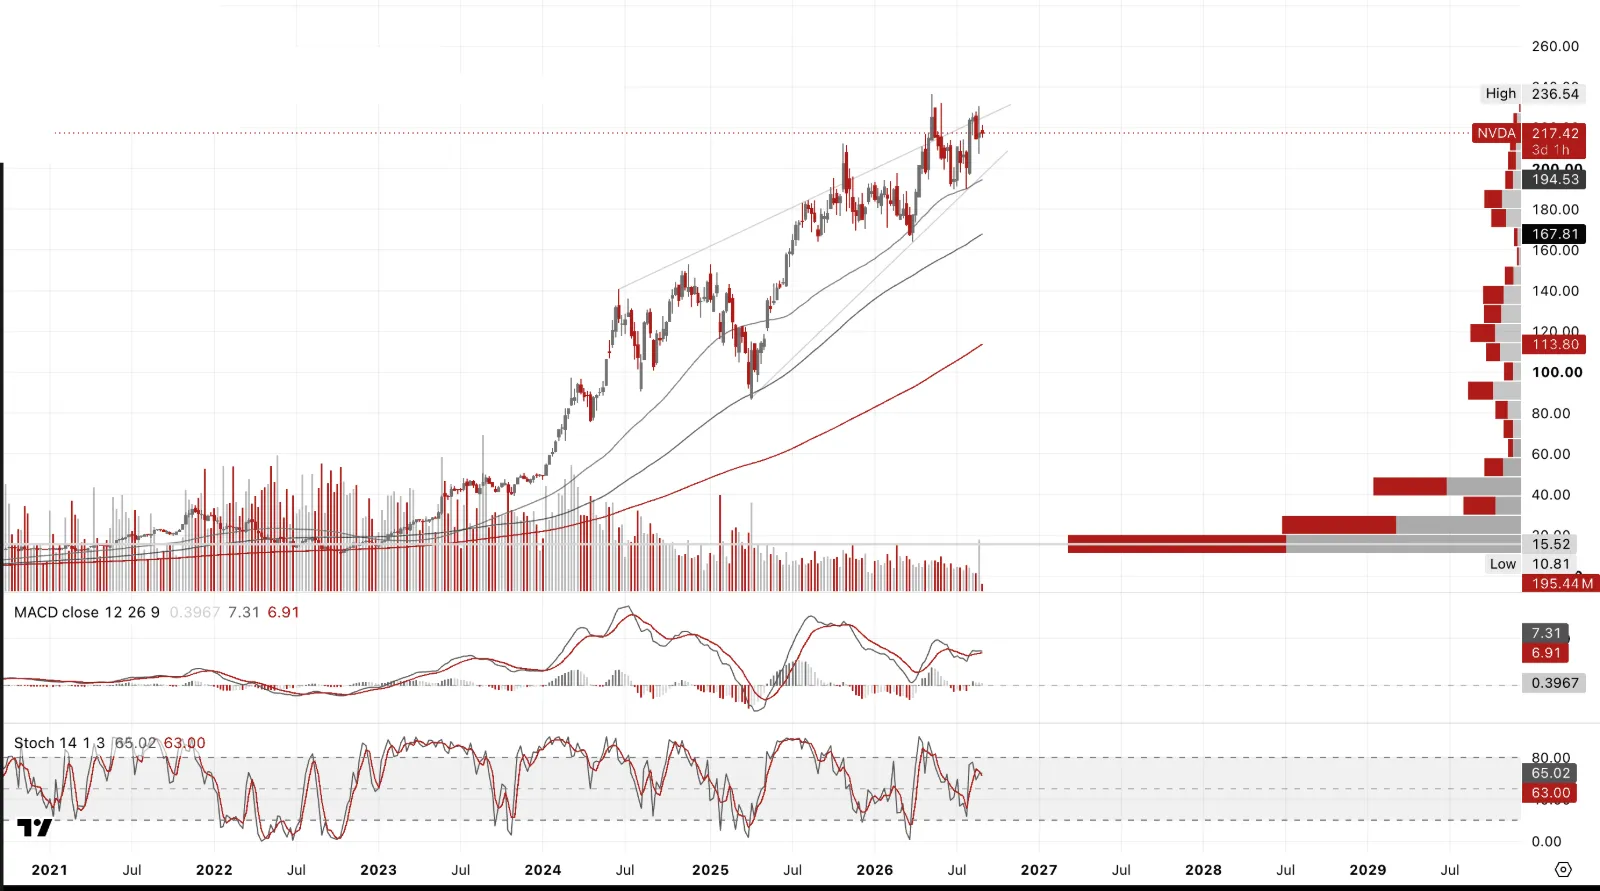
NVIDIA. Low P/E here is not the same thing as cheap. Earnings have been growing so fast that the multiple compresses even as the underlying risk in the business is rising, that's the reflexive trap, a falling P/E looks like value right up until the earnings themselves are the thing in question. Heading into the recent print the stock still jumped nearly 9% on a beat and a 70% FY28 growth guide against 44% expected, which tells you sentiment is still doing a lot of the work here regardless of the multiple.
And the 10-Q underneath that beat is genuinely revealing. Three customers account for 44% of first-half revenue, five customers for 70% of receivables, and Nvidia has been extending payment terms to some of its largest customers, receivables jumped from $38.5 billion to $63.1 billion in six months. None of that shows up in the P/E. It shows up in the footnotes, and it's exactly the kind of concentration risk a cheap-looking multiple is currently masking rather than reflecting.
Worth noting Nvidia's own presence in the US equity indices has grown right alongside the semis, replacing Intel in the Dow in 2024, with Alphabet joining behind it this June. Mega-cap tech now effectively sets the tone for the "blue chip" average too, not just the Nasdaq. Hence the disconnect of DJIA to DJT and DJU.
SpaceX
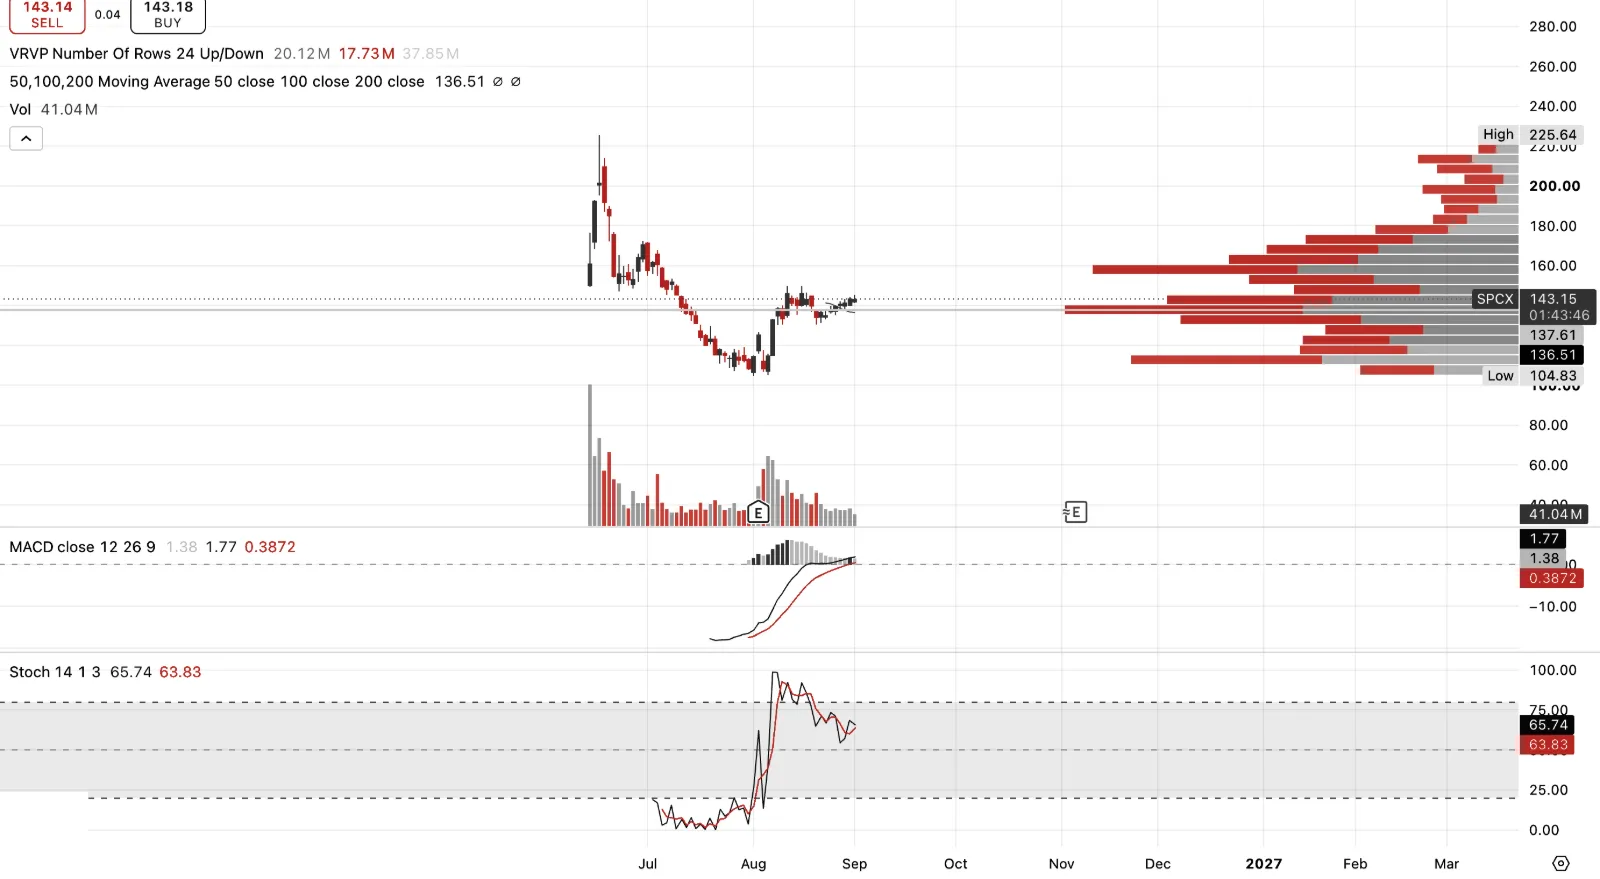
SpaceX, and Musk's data-centres-in-space ambition is the most audacious version of the AI infrastructure story in this entire letter. February's all-stock xAI merger folded Musk's AI company in at a combined $1.25 trillion valuation specifically to fund "orbital data centers that can power artificial intelligence at a scale not possible on Earth," alongside a Tesla-SpaceX-xAI chip effort called Terafab with up to $119 billion of disclosed capex. The pitch is genuinely singular, launch capacity, satellite bandwidth and AI compute all owned by the same company, orbital data centers solving the power and cooling constraints that are choking terrestrial buildouts everywhere else.
But look at what the stock already did. IPO at $135, straight up 67% to a high of $225.64, then straight back down 53% to $104.83, now sitting at $143.15, essentially back to where it listed. That's the classic hot-IPO pattern, a rapid rise followed by early holders and insiders offering stock into the rally, SpaceX has run twice-yearly tender offers for years precisely to let employees and early investors do this.
History says you get to buy this cheaper, probably much cheaper, before this is done, even if Musk has the clout to eventually deliver on the combined bet, Starlink's genuinely profitable cash engine, Grok and xAI's compute ambitions, and the wider Musk ecosystem of Tesla autonomy, Optimus and vehicles that sits adjacent to this stock even if it isn't formally inside it. Worth remembering xAI is currently a financial drag on the combined entity, not a contributor, the company posted a near $5 billion GAAP loss in 2025 despite Starlink's own profitability. Being right about the destination has never stopped this kind of chart from giving you a better entry first.
Long Cycles
Long Cycles — Gold Leads
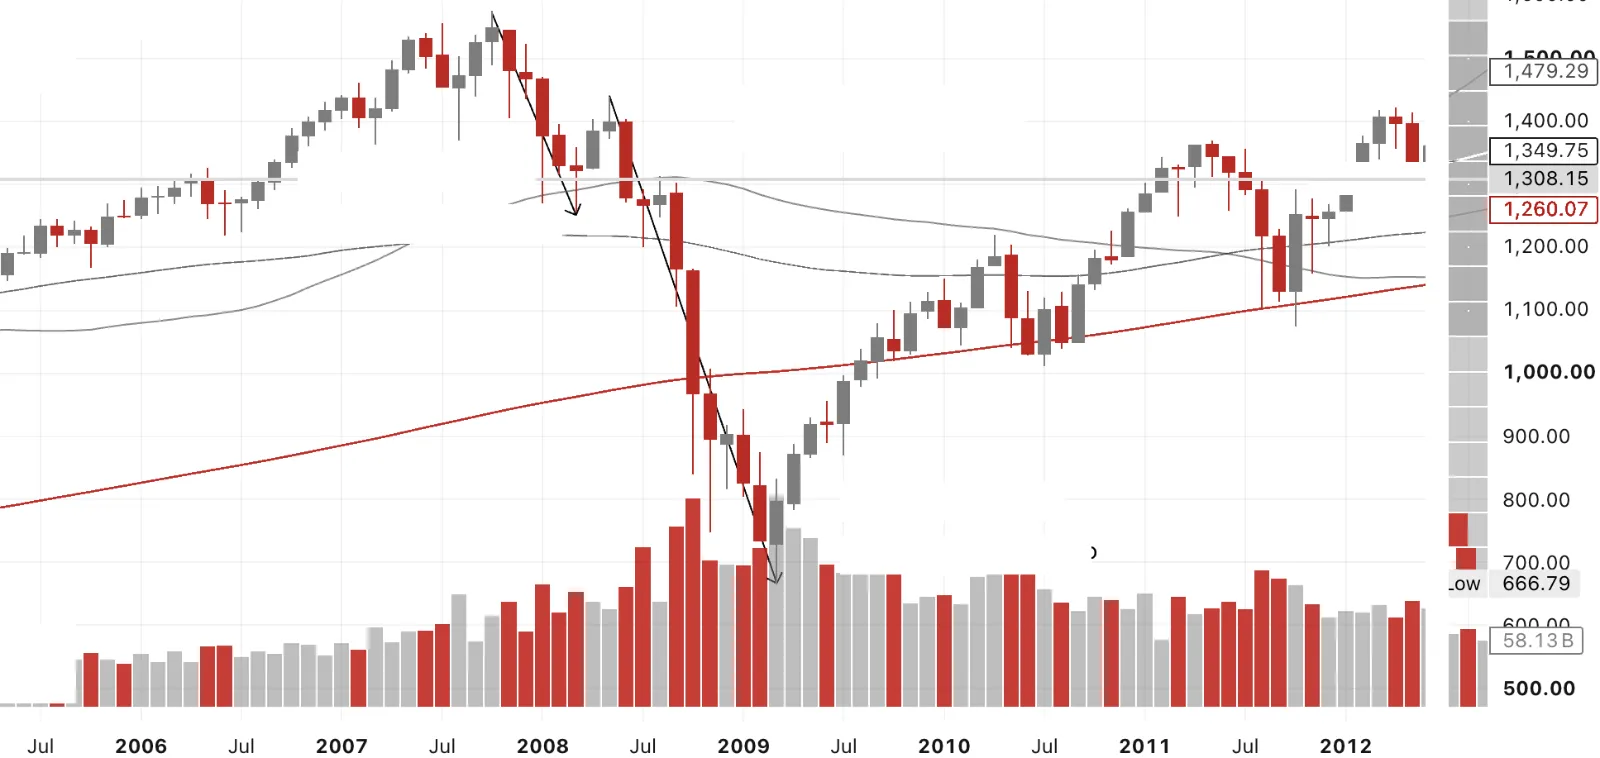 SPX Lags XAUSPX 20.3% DeclineOct 07 Hi to Mar 08 LoSPX 53.7% DeclineMay 08 Hi to Mar 09 Lo
The purpose of this pair of charts here SPX lags XAU and XAU leads is to show what excess equity valuations look like unwinding against gold, using the last genuine precedent. SPX topped in October 2007 and fell 20.3% into March 2008, a first warning shock. It then cratered 53.7% from the May 2008 high to the March 2009 low, the real capitulation. Gold's own pullback over that same May-to-October 2008 window was a comparatively shallow 27%, and by November 2008 gold was already rallying hard while SPX was still making new lows into March. That lag is the whole thesis. Gold doesn't wait for the equity bottom to be confirmed. It leads.
Long Cycles — Gold Leads
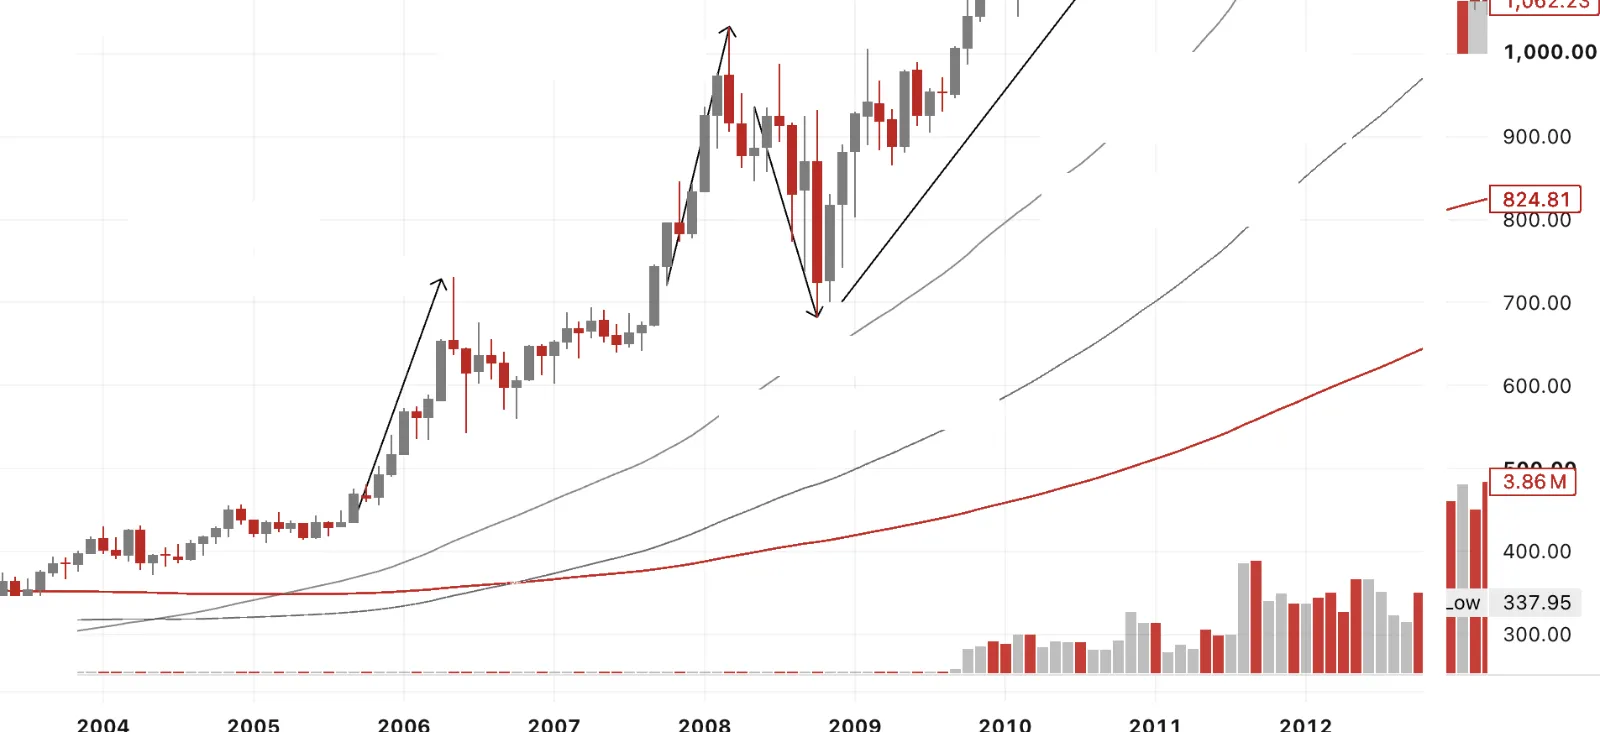 XAU rallied 43%Oct 07 Lo to Mar 08 HiXAU Smartly rallies
Nov 08 onwards
As SPX craters into Mar 09XAU Leads…XAU rallied 68%Sept 05 Lo to May 06 HiXAU Declined 27%May 08 Hi to Oct 08 Lo
Same period, gold's side of the story. Gold rallied 68% from the September 2005 low to the May 2006 high, then another 43% from the October 2007 low into the March 2008 high, both moves running well ahead of the SPX top. When gold did pull back, May to October 2008, it was a 27% decline against equities' 53.7% collapse, and gold turned in November 2008, four months before SPX finally bottomed in March 2009. This is the concept I'm working from now. Even if gold takes out this year's lows toward 3,750 or lower, that wobble will be later based on this precedent.
Short Term — Long Gold Calls, SPX and NDX Puts
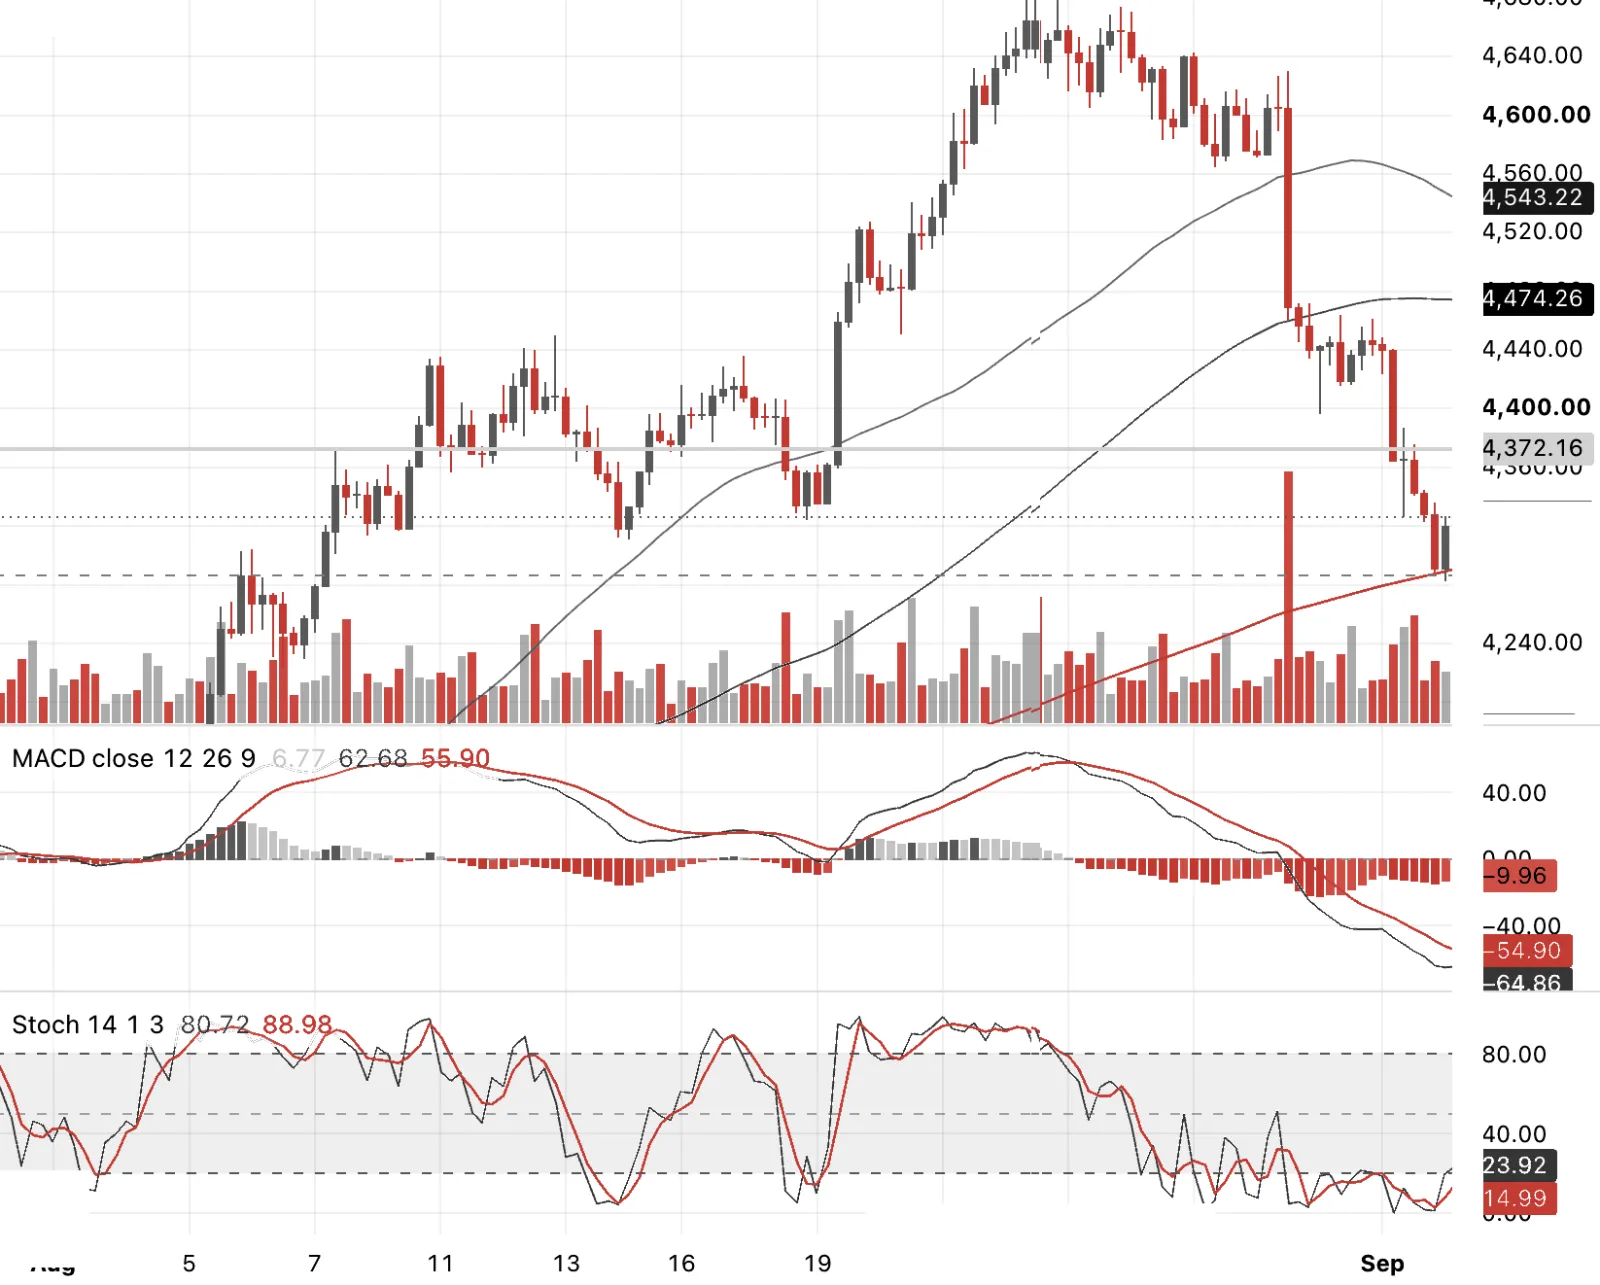
On the Gold spot 4hr chart the market profile suggested $4,280 to 90 as a nearer-term target ahead of Non-Farm Payrolls this week, and we have hit there. I've fully hedged my 4,300 October gold puts with the intention to be long gold vs a basket of naked shorts and puts on the equity indices, expressing the SPX-gold and Nasdaq-gold ratio moving in gold's favour rather than taking a view on gold's dollar price alone. I have bought $4400 calls this morning selling out of hedge and puts entirely.
Short Term — Long Gold Calls, SPX and NDX Puts
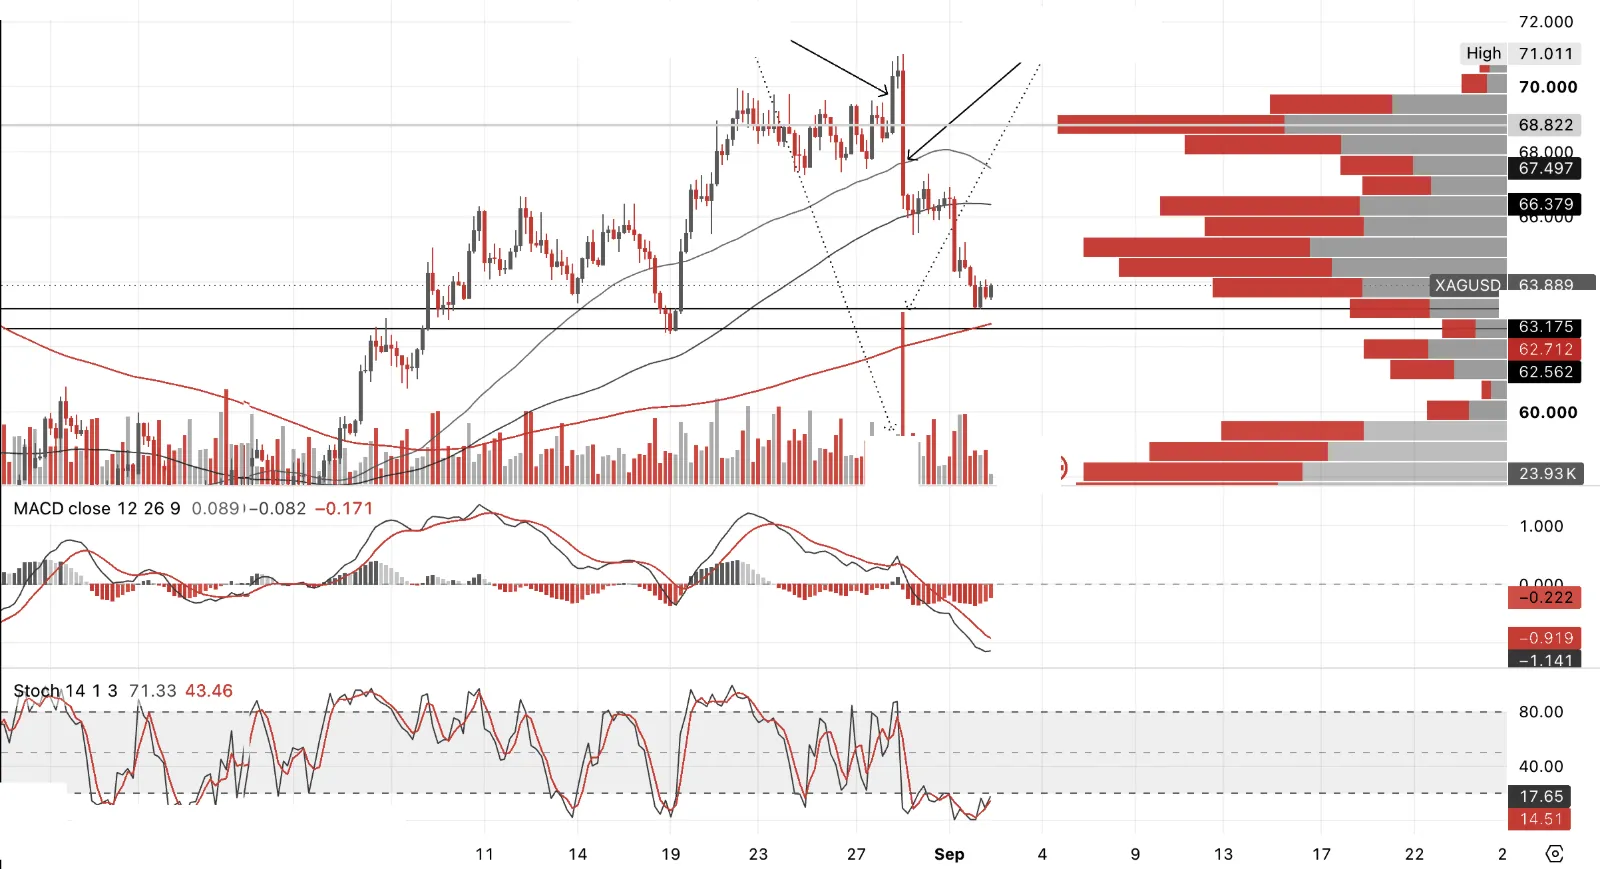 Low Volume break on
4h above $70Bearish Engulfing
High Volume failure
Quick explainer on what happened here. A breakout on low volume means price pushed through a level, in this case $70, without much real buying behind it, few participants, thin conviction, the kind of move that often comes from momentum chasers or stops being triggered rather than genuine new demand. That makes it fragile.
A bearish engulfing candle is a single period where price opens above the prior candle's close, then reverses so hard it closes below the prior candle's open, effectively swallowing the whole previous move. When that happens on high volume, it means real sellers showed up in size, using the break as their exit or their entry to sell short, exactly where the low-volume buyers had just committed.
Put those two together and you get a textbook failed breakout, weak buying pushes price to a new high, strong selling immediately overwhelms it. That's a more reliable reversal signal than either piece on its own, because it tells you who was actually in control at the moment that mattered.
Long the 64 silver puts, October expiry, executed the day before Jackson Hole. Sold into the rally with abated breath, volume was very low, never fully trusted the move. A classic A-B-C correction, where AB equals BC, looked to be on the cards, but that would have been too cute, the horizontal lines are my actual target areas instead.
It's tough being short when you're a semi-perma bull, so I fully hedged the 64 puts at 63.55 and sold the puts once the 4-hour chart showed a rebound and a potential low in. So I'm long some silver against the equity downside risk described above, though I'll likely be selling that silver out today and trading around the leg while staying short the indices.
Short Term — Long Gold Calls, SPX and NDX Puts
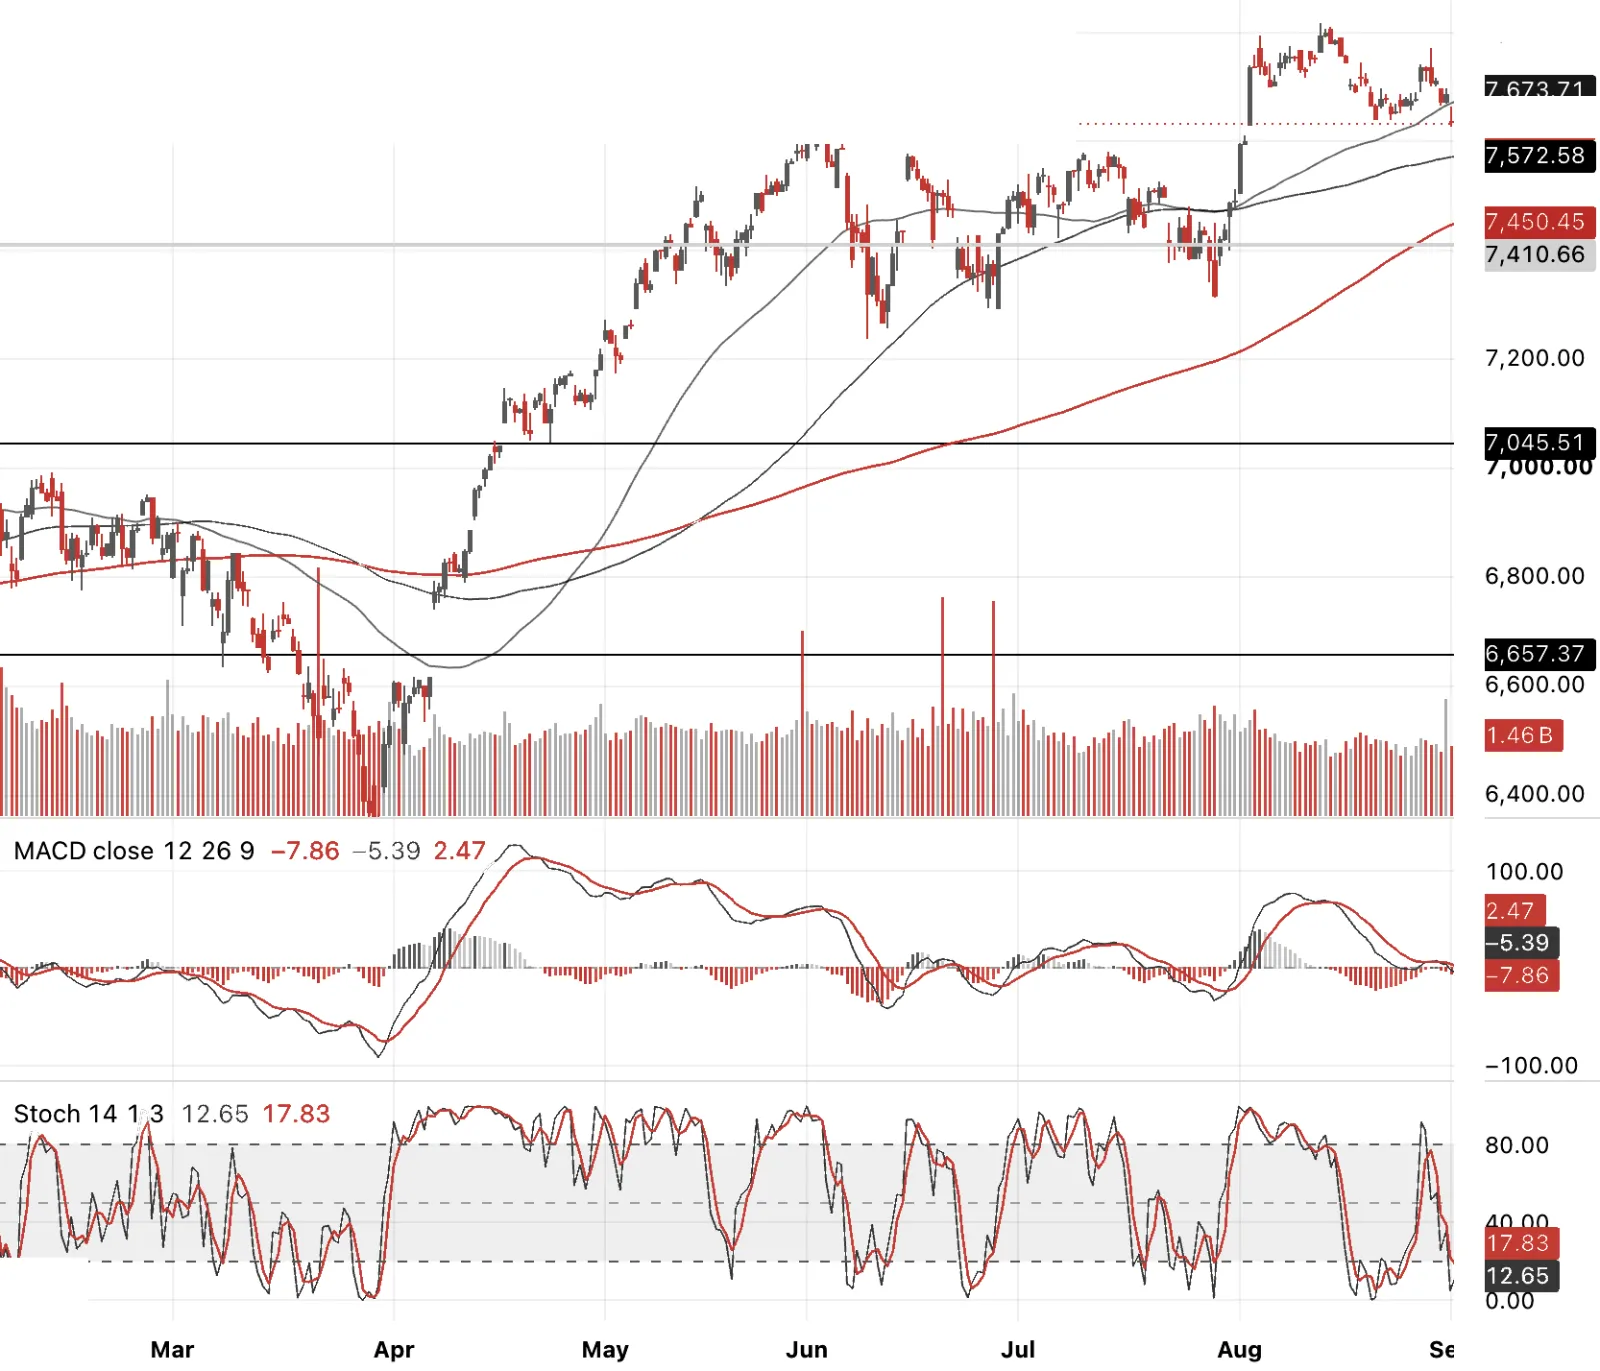
Naked shorts plus ATM puts at 7,640 and 7,600, October expiry. This is the short-term leg into NFP, but I want to be clear it's sitting on top of a medium-term view already, a 15-20% correction I think is already underway, everything covered across today's charts, credit not confirming equities, Dow Theory non-confirmation across two legs, the AI hedge fund unwind, tightening financial conditions. The October dating gives this room to work if it's more than a one-week wobble.
Short Term — Long Gold Calls, SPX and NDX Puts
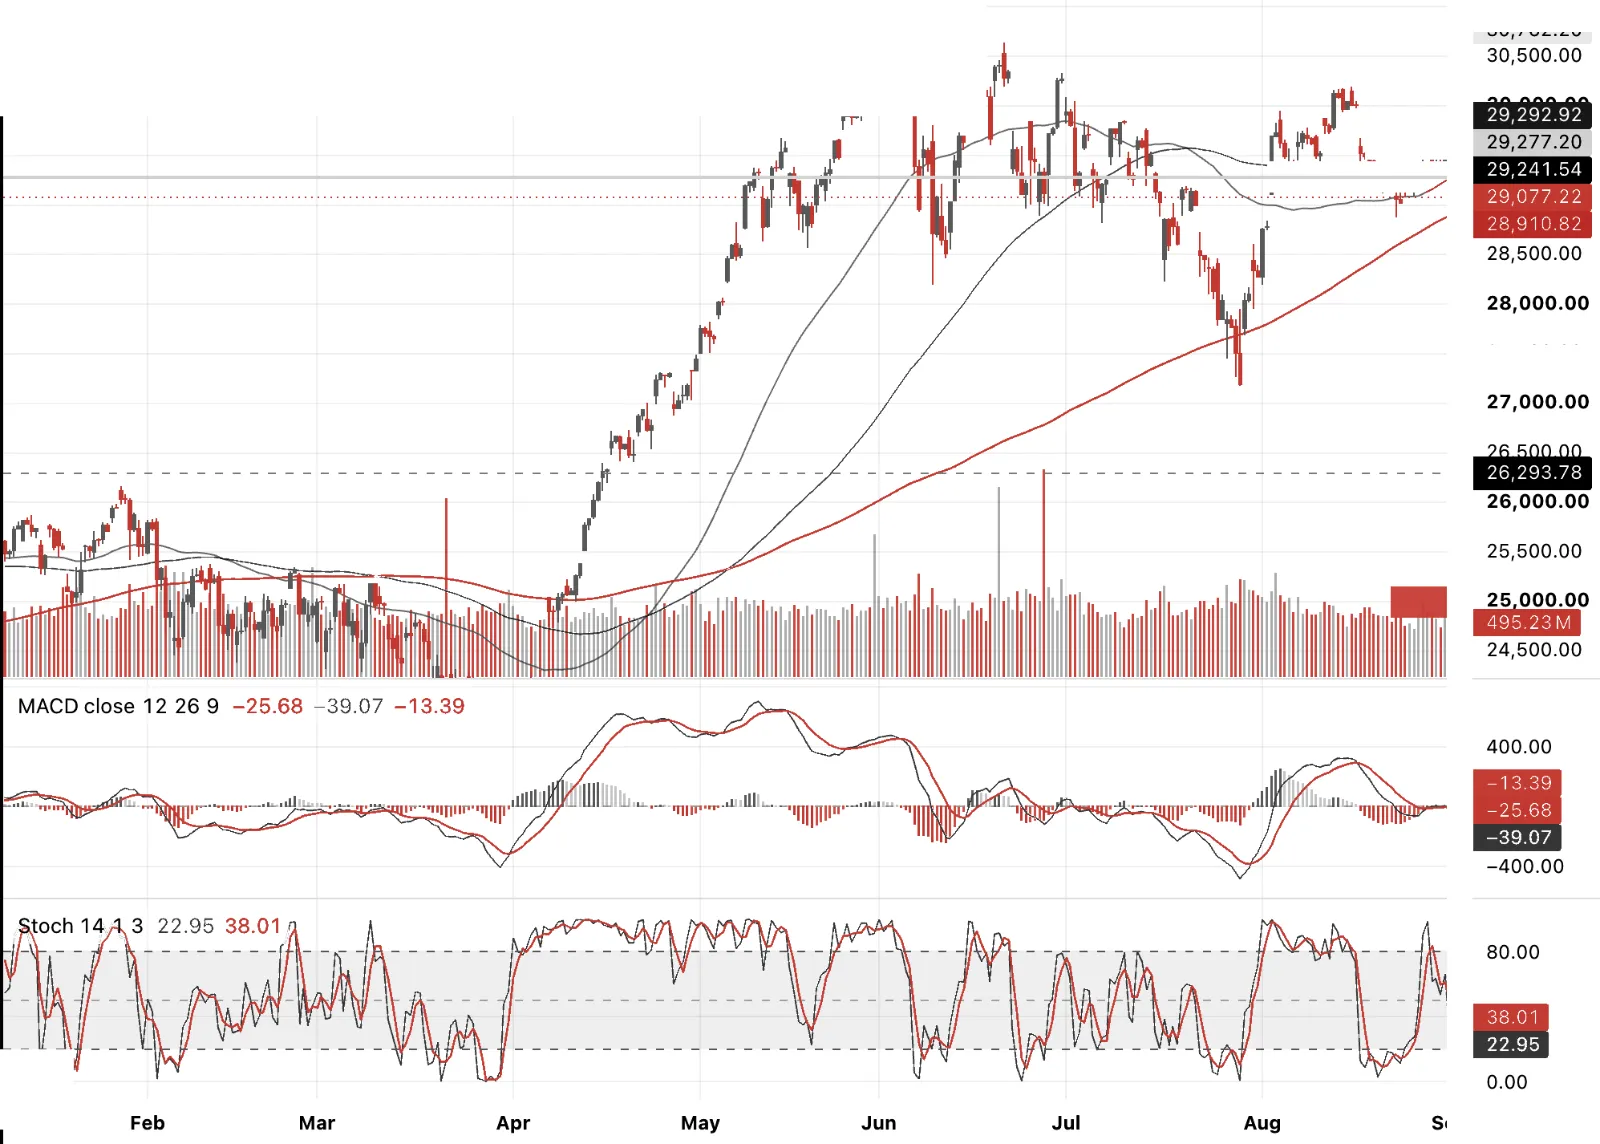
NDX non-confirmation vs DJIA and SPX and 4hr chart rolling over with dailies. Own OTM puts at 27,000, 26,000 and 24,000, October expiry, plus a flyer on September 26,000 puts. That near-dated flyer is cheap specifically because VXN is running low relative to VIX and broader stock vol right now, so I'm paying less for convexity on the index that's arguably most exposed to everything this whole piece has been about. Same medium-term correction thesis as SPX, just expressed where the AI and semiconductor concentration risk actually lives. I keep coming back to whether this is a series of snowflakes that eventually accumulates into something with real reflexive power to build a rolling show ball that takes indices not down 20% rather 40%+. Let’s see.
This is not investment advice. It is one person thinking out loud about markets, usually with a position on, so assume I may be talking my own book. That is not a confession, merely useful information. Views can change quickly, occasionally before the ink is dry, and I am not going to defend a trade simply because I once wrote about it with great conviction. Nothing here is an offer, solicitation or recommendation to buy or sell anything.
I write HindeSight primarily for me. The process forces me to test the thesis, join a few dots, throw some away and, with luck, understand the problem rather better than when I started. If it sparks a thought in someone else, even better. There is no publication schedule. I write when I have something to say or when the urge becomes sufficiently annoying that writing it down is easier. I can be tactically bearish and medium-term bullish, long one week and short the next. Markets rarely reward consistency for consistency’s sake. My objective is simpler: find the best risk/reward and try to extract as much upside as possible while giving as little back as possible.
Hinde Capital no longer manages external capital, so there is nothing to sell you. Past performance is no guide to future returns and, frankly, neither is this letter. Do your own work, size risk so you can still sleep, and seek regulated advice where appropriate. No liability is accepted for losses arising from reliance on this material, including those incurred after forwarding it to your sister- or brother-in-law. © Hinde Capital 2026.